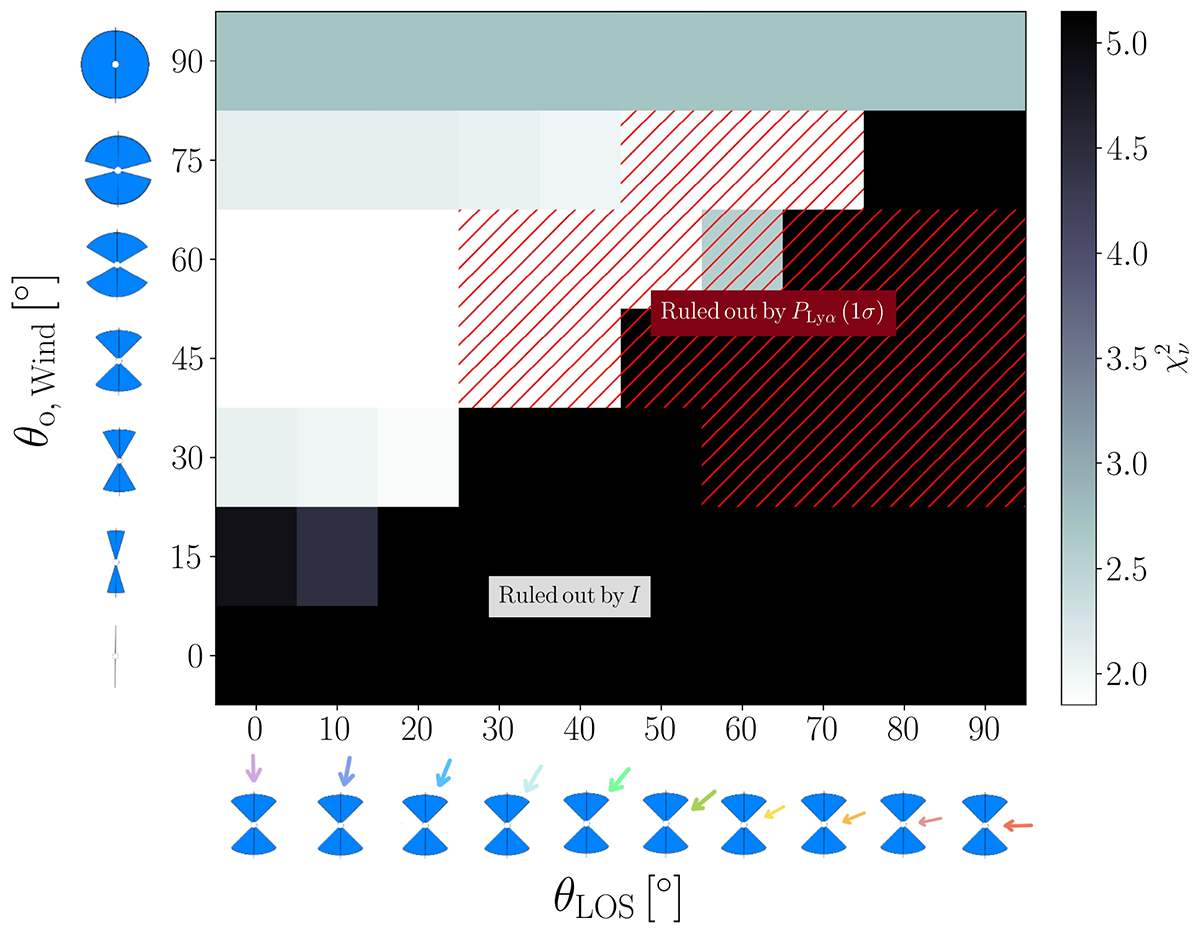
Fig. 7.
Download original image
Comparison between observations and wind models at NH I = 1020 cm−2, vexp = 200 km s−1, σSrc = 150 km s−1. The sketches along the axes give a visual representation of the models, with increasing θo, Wind along the y-axis and increasing θLOS along the x-axis, represented with arrows colored according to Fig. 6. The gray scale indicates the agreement between the observed and modeled total intensities I, evaluated through the χν2 value (colorbar on the right), with lighter tones representing better agreement (see the top row of Fig. 6). Red hatched regions rule out models whose degree of polarization PLyα is larger than (and thus not consistent with) the observational 1σ upper limit PLyα (see the bottom row of Fig. 6).
Current usage metrics show cumulative count of Article Views (full-text article views including HTML views, PDF and ePub downloads, according to the available data) and Abstracts Views on Vision4Press platform.
Data correspond to usage on the plateform after 2015. The current usage metrics is available 48-96 hours after online publication and is updated daily on week days.
Initial download of the metrics may take a while.