Fig. 6.
Download original image
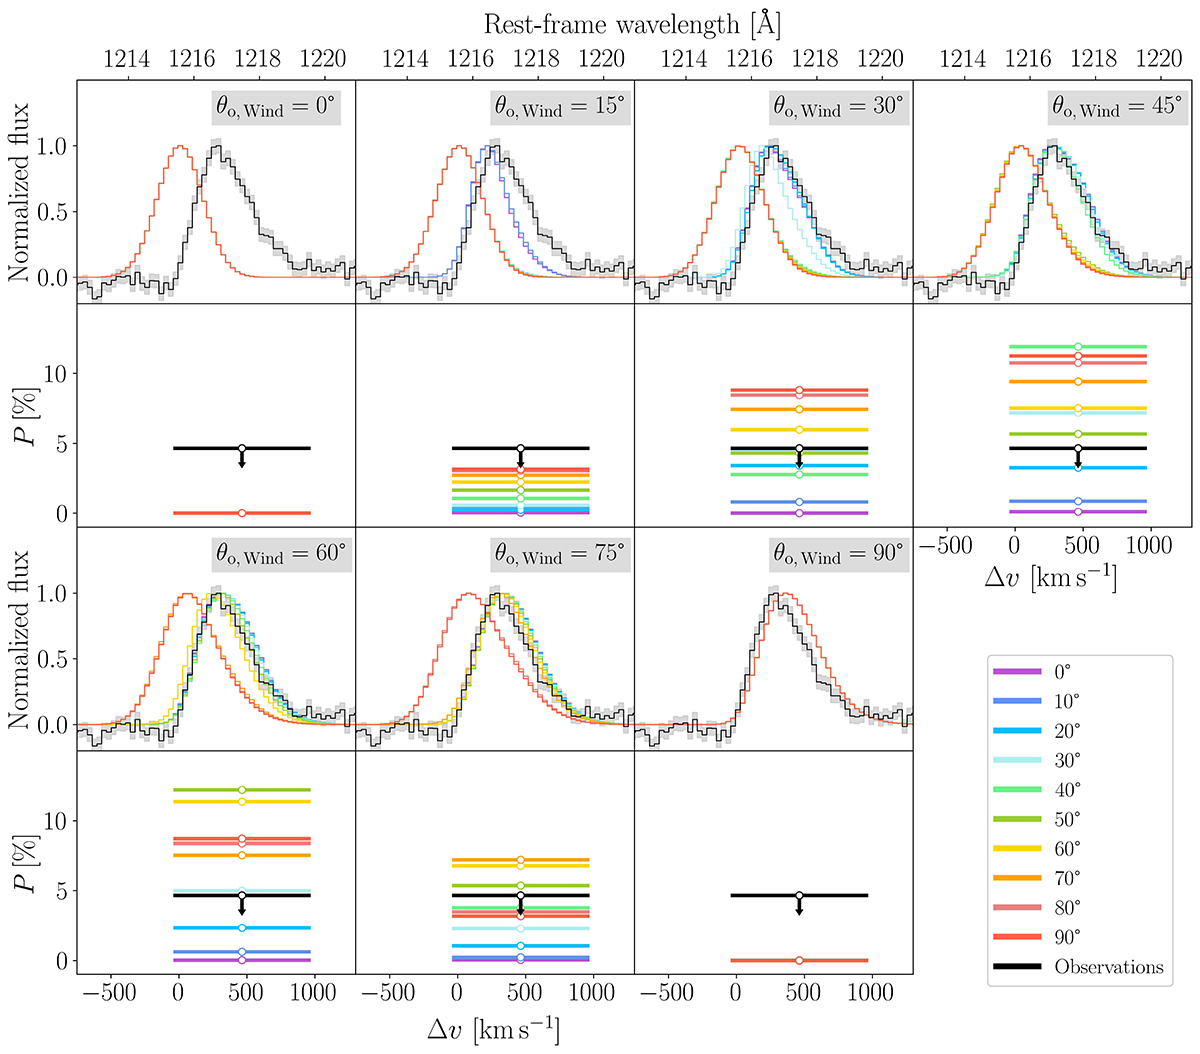
Top and third rows: Observed (black, with 1σ uncertainties in gray) and modeled (with different colors denoting different line-of-sight angles, θLOS, reported in the legend) normalized total intensity spectra I, assuming a H I column density NH I of 1020 cm−2, an outflow velocity vexp of 200 km s−1, and a Gaussian width of intrinsic LyασSrc of 150 km s−1, in the case of θo, Wind = 0° ,15° ,30° ,45° ,60° ,75° ,90°, from left to right, as indicated in the gray labels. Second and bottom rows: Polarization fraction relative to the model described in the corresponding row above. The black open circles represent the observational 1σ upper limit of PLyα = 4.6%. The uncertainties for the models are smaller than the linewidths.
Current usage metrics show cumulative count of Article Views (full-text article views including HTML views, PDF and ePub downloads, according to the available data) and Abstracts Views on Vision4Press platform.
Data correspond to usage on the plateform after 2015. The current usage metrics is available 48-96 hours after online publication and is updated daily on week days.
Initial download of the metrics may take a while.