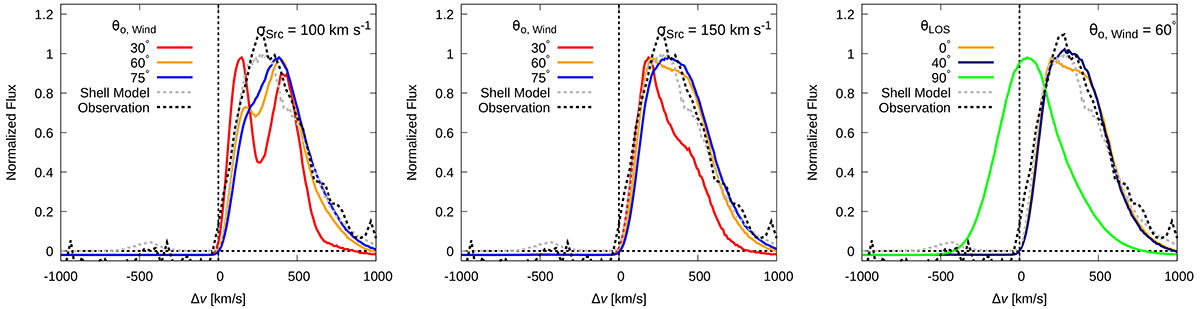
Fig. 4.
Download original image
Comparisons between observed and simulated Lyα spectra. The simulated spectra of the wind models are normalized by setting the same peak height as the spectrum of the previous fit with the shell model. The black dashed line is the observed Lyα spectrum, which is continuum subtracted. The gray dashed line is the simulated Lyα spectrum of the shell model from Iani et al. (2021). In the left and middle panels line colors represent, for σSrc equal to, respectively, 100 km s−1 and 150 km s−1, θo, Wind = 30° (red), 60° (orange), and 75° (blue), with θLOS fixed to 0°. In the right panel, θo, Wind is fixed to 60°, and line colors represent θLOS = 0° (orange), 40° (blue), and 90° (green).
Current usage metrics show cumulative count of Article Views (full-text article views including HTML views, PDF and ePub downloads, according to the available data) and Abstracts Views on Vision4Press platform.
Data correspond to usage on the plateform after 2015. The current usage metrics is available 48-96 hours after online publication and is updated daily on week days.
Initial download of the metrics may take a while.