Fig. D.1.
Download original image
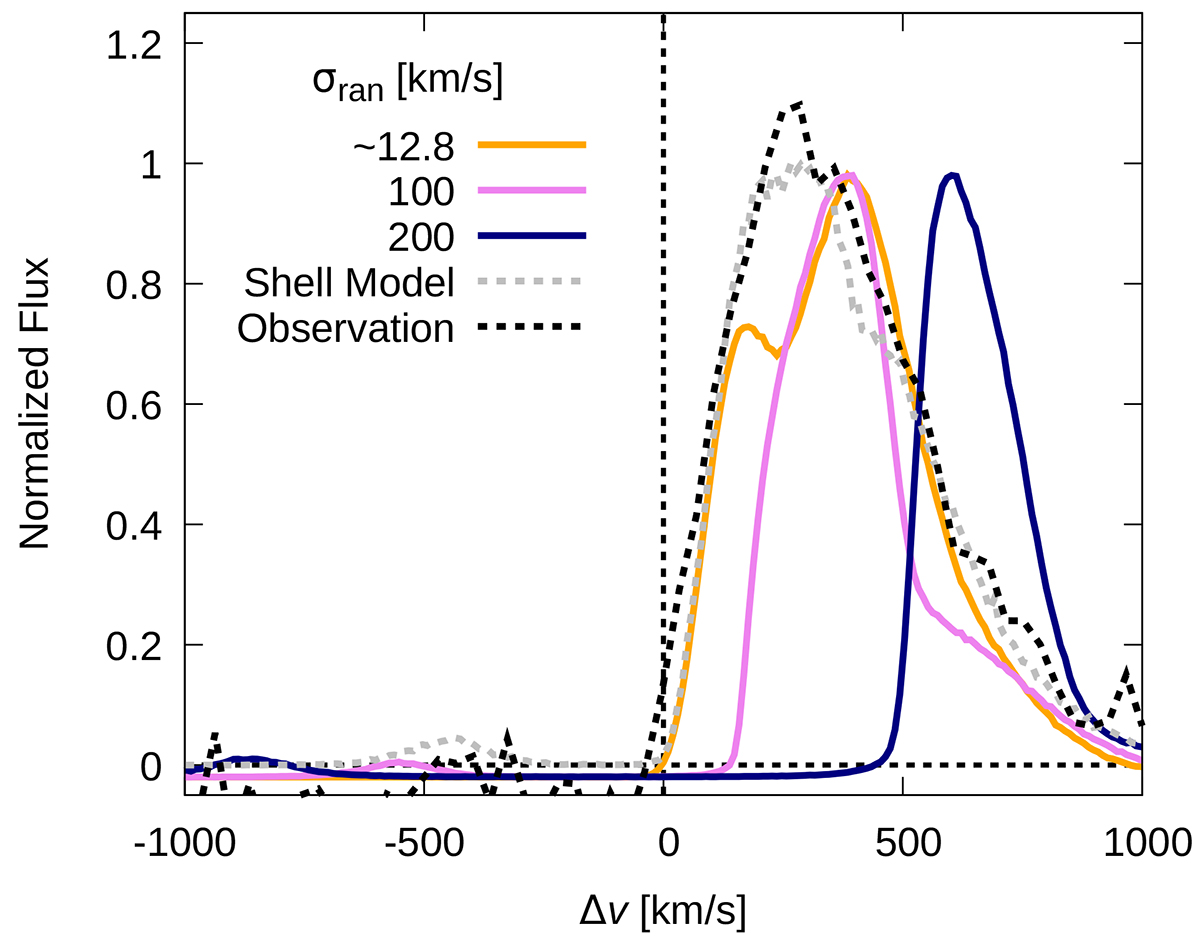
Simulated Lyα spectra for various random motions of the H I bipolar wind (σran = 12.8, 100, and 200 km s−1) at θo, Wind = 60° and θLOS = 0°. The intrinsic line width σSrc is fixed at 100 km s−1, based on the shell model in Iani et al. (2021). The black and gray dashed lines represent the observed spectrum and the shell model spectrum, respectively. The orange line corresponds to the spectrum at θo, Wind = 60° from Fig. 4. The navy and violet lines are spectra for σran = 100 and 200 km s−1, respectively. Higher random motion induces redshifting and deviation from the observed spectrum. The simulated spectra are normalized by setting the same peak height as the spectrum of the previous fit with the shell model.
Current usage metrics show cumulative count of Article Views (full-text article views including HTML views, PDF and ePub downloads, according to the available data) and Abstracts Views on Vision4Press platform.
Data correspond to usage on the plateform after 2015. The current usage metrics is available 48-96 hours after online publication and is updated daily on week days.
Initial download of the metrics may take a while.