Fig. 1.
Download original image
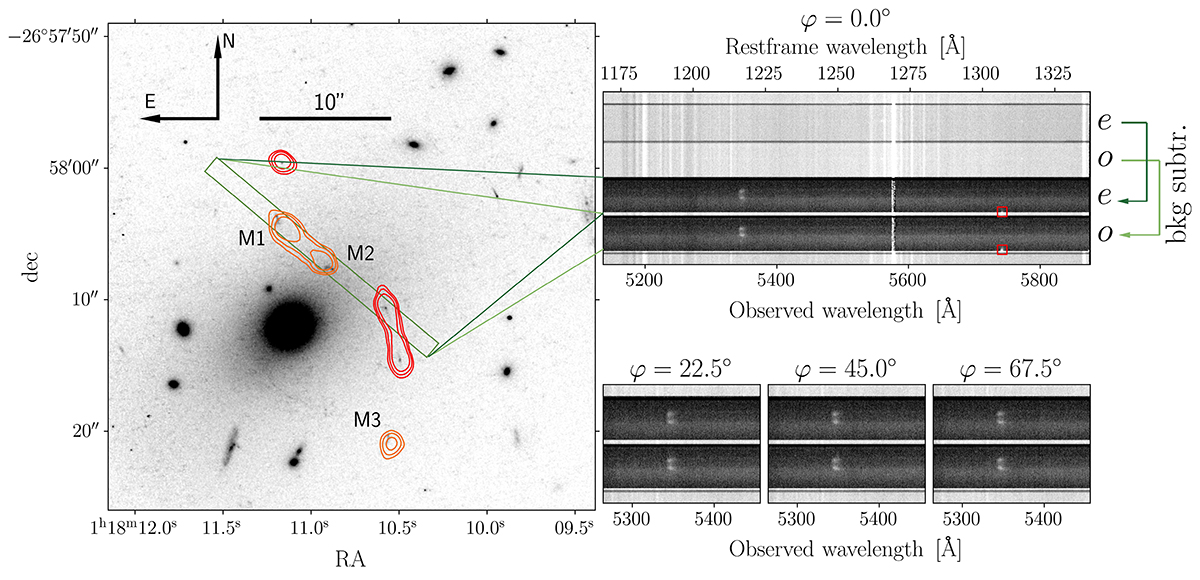
Left: HST F606W image of the inner part of A2895, where the three multiple images of Abell 2895a (M1, M2, and M3) appear. It represents the rest-frame UV at the redshift of Abell 2895a, z ∼ 3.4. In orange, we show the 2, 3, and 5σ contours of the Lyα emission, detected with MUSE. The green box represents the FORS2 1.4″ × 22″ adopted slit, that includes M1 and M2, and one image of another source at z ∼ 3.7 (Iani et al. 2023), whose Lyα 2, 3, and 5σ contours are shown in red. Thanks to the PMOS mode, the signal included in the slit is split in an ordinary (o) and extraordinary (e) ray, with orthogonal polarizations, shown with different tones of green. Right: Stacked 2D spectrum with φ = 0.0° obtained after calibration, cosmic ray rejection, and sky subtraction. In particular, the sky is subtracted only in the relevant slits which contain Abell 2895a, and appear darker. Each slit has a spatial (vertical) width of 22″, and the sky level is estimated and then subtracted from the closest ordinary and extraordinary slits (see the e and o labels on the right), respectively, as shown by the green arrows on the right. In the slits including the target, we detect the extended Lyα emission associated with M1 and M2, at approximately 5340 Å, the continuum from the nearby BCG, in the bottom part, and the Lyα emission of the source at z ∼ 3.7 (red squares, close to the edge of the slitlets). We show the 2D spectrum taken with φ = 0.0° on top, and smaller cutouts around the Lyα line for φ = 22.5°, 45.0° and 67.5° on the bottom.
Current usage metrics show cumulative count of Article Views (full-text article views including HTML views, PDF and ePub downloads, according to the available data) and Abstracts Views on Vision4Press platform.
Data correspond to usage on the plateform after 2015. The current usage metrics is available 48-96 hours after online publication and is updated daily on week days.
Initial download of the metrics may take a while.