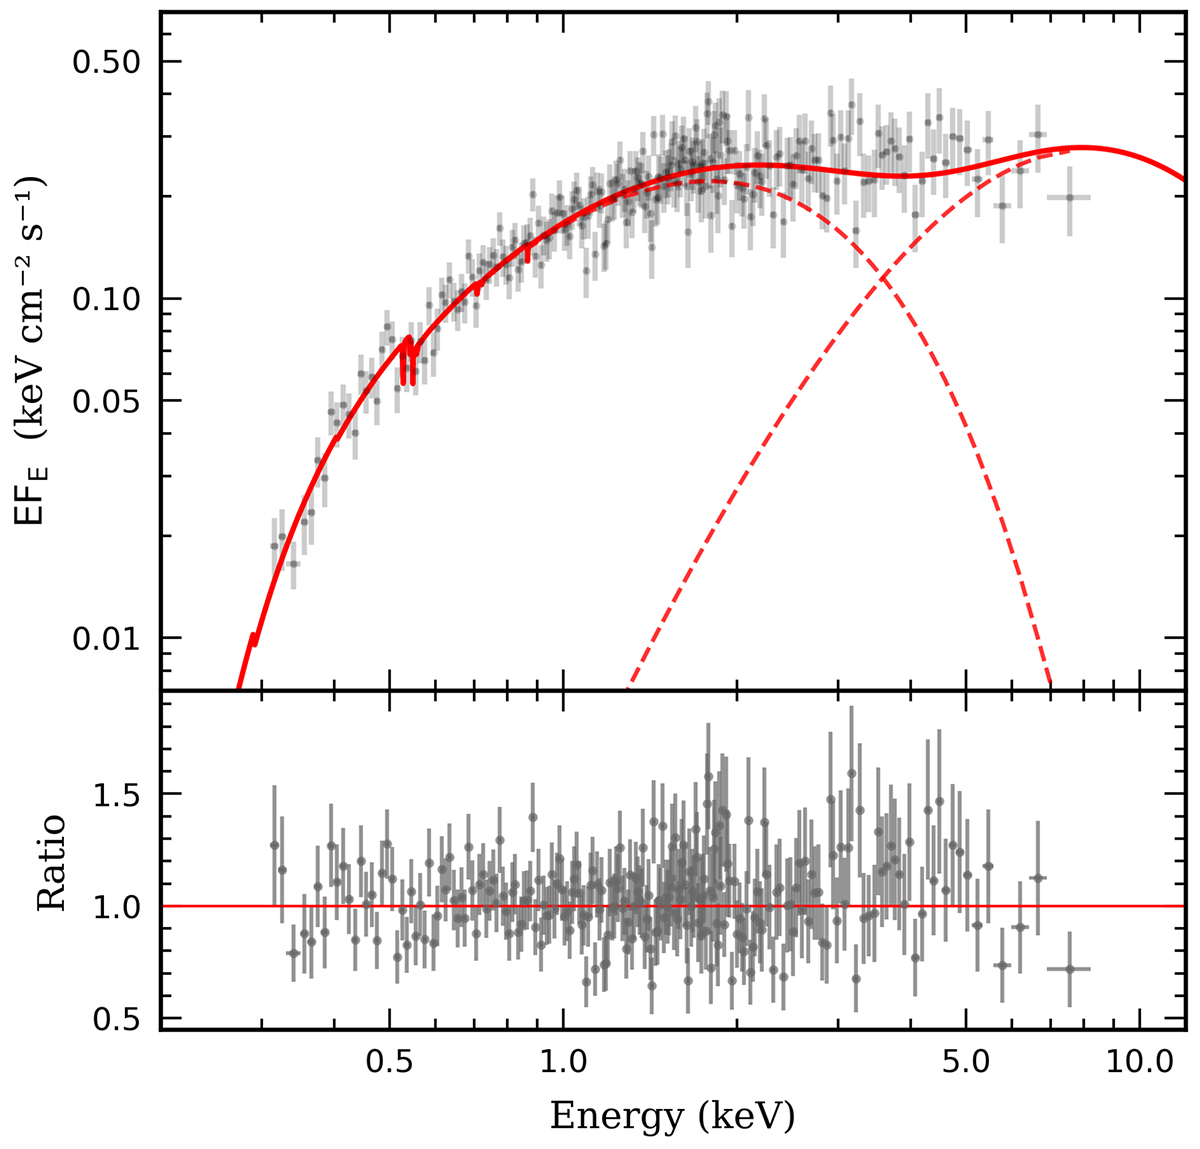
Fig. 2.
Download original image
X-ray spectrum of the pre-burst emission for burst #4. Spectra of other bursts are shown in Fig. A.1. The solid red line represents the total model tbabs*(diskbb+comptt), while the dashed lines represent diskbb and comptt components separately, and the gray points show the data. The pre-burst emission was chosen as a 20 s interval taking place 20 s before the burst.
Current usage metrics show cumulative count of Article Views (full-text article views including HTML views, PDF and ePub downloads, according to the available data) and Abstracts Views on Vision4Press platform.
Data correspond to usage on the plateform after 2015. The current usage metrics is available 48-96 hours after online publication and is updated daily on week days.
Initial download of the metrics may take a while.