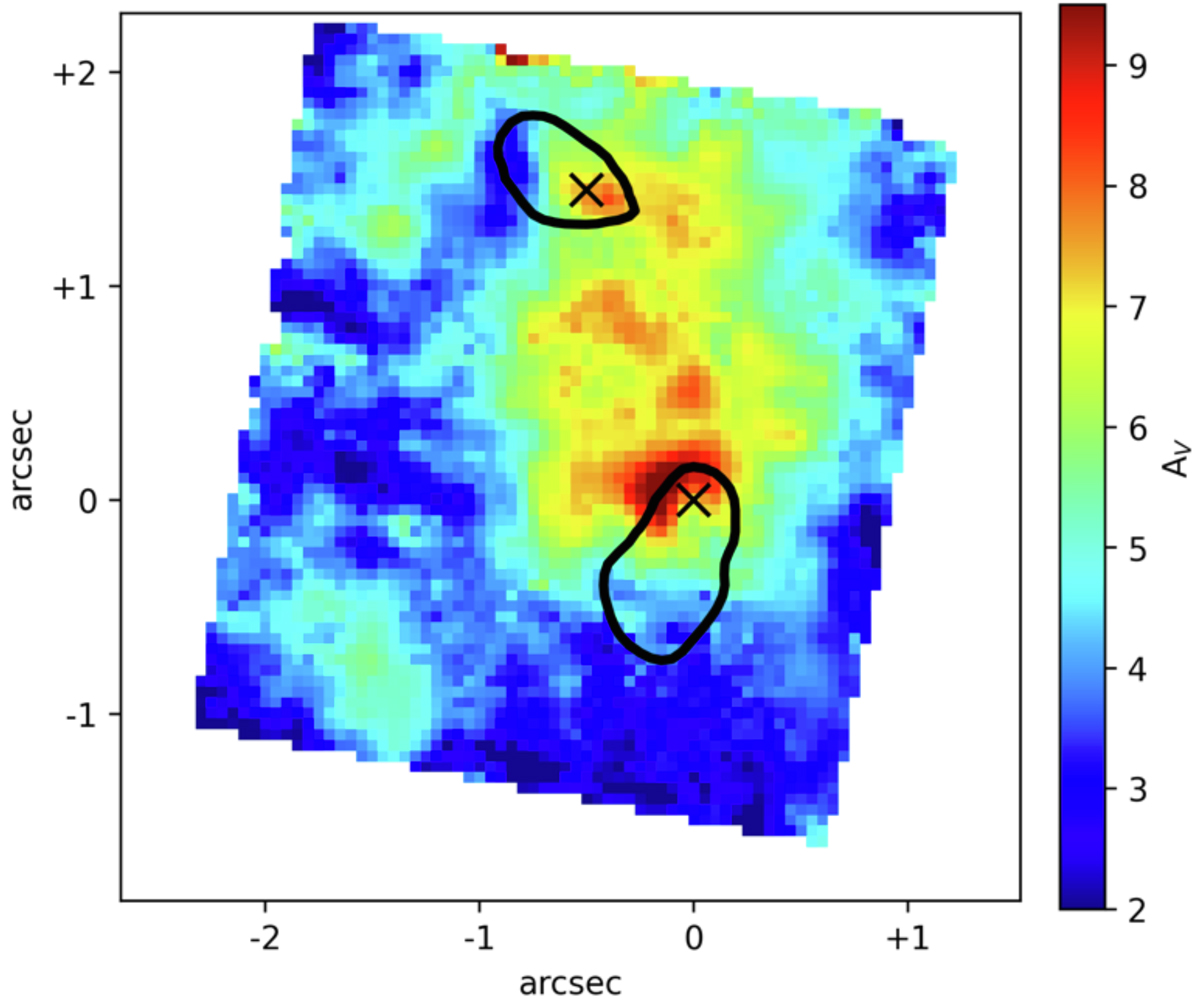
Fig. 9.
Download original image
Extinction map used for dust correction of data. It was obtained as a combination of the extinction maps of the iron line ratio and the Paschen decrement of Fig. 8 (see text in Section 3.5 for details). Crosses indicate the positions of the nuclei. Black contours are the same as those in Fig. 6, and indicate the regions where most of the continuum emission originates.
Current usage metrics show cumulative count of Article Views (full-text article views including HTML views, PDF and ePub downloads, according to the available data) and Abstracts Views on Vision4Press platform.
Data correspond to usage on the plateform after 2015. The current usage metrics is available 48-96 hours after online publication and is updated daily on week days.
Initial download of the metrics may take a while.