Fig. 7.
Download original image
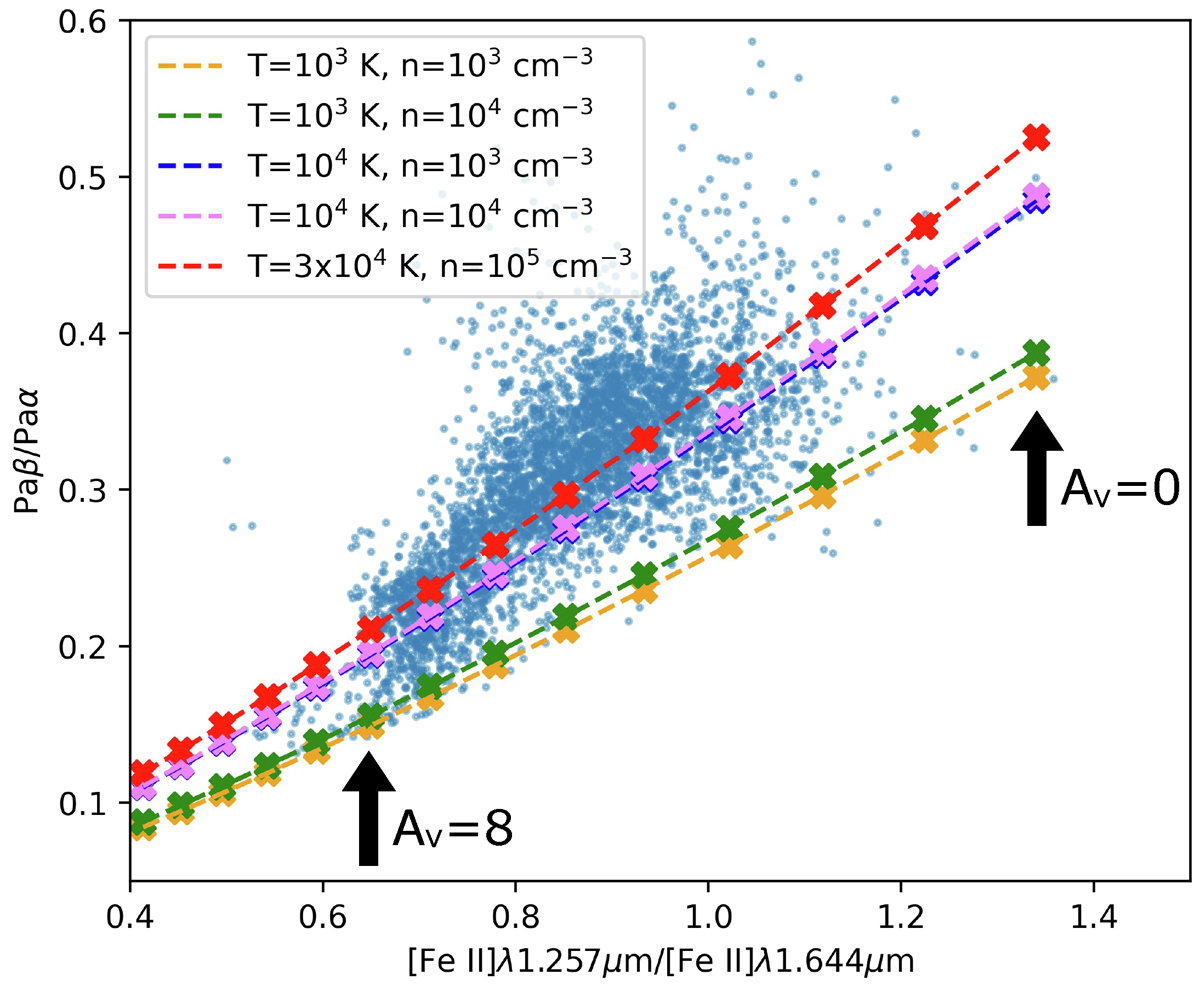
Line ratios diagram used to compute the extinction. Blue points are the observed line ratios of Paβ/Paα and [Fe II]λ1.257 μm/[Fe II]λ1.644 μm. Dashed lines fit extinction values computed assuming theoretical line ratios based on the Cardelli et al. (1989) extinction law and different electronic temperatures and densities (as indicated). The symbols along the model lines mark optical extinction values in steps of AV = 1, increasing from right to left.
Current usage metrics show cumulative count of Article Views (full-text article views including HTML views, PDF and ePub downloads, according to the available data) and Abstracts Views on Vision4Press platform.
Data correspond to usage on the plateform after 2015. The current usage metrics is available 48-96 hours after online publication and is updated daily on week days.
Initial download of the metrics may take a while.