Fig. 6.
Download original image
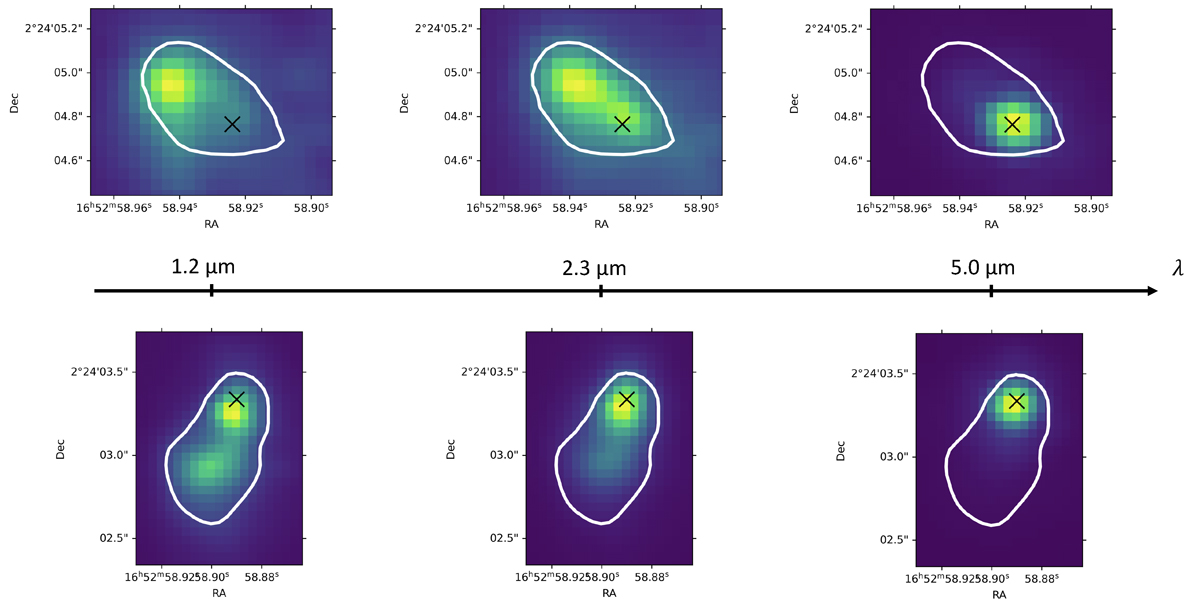
Zoomed-in continuum maps of the northern (top) and southern (bottom) nuclear region for different rest-frame wavelengths, as indicated by the axis. Crosses indicate the positions of the nuclei. White contours of the continuum flux are overplotted as a spatial reference (for the southern nucleus we used 19% of the 1.2 μm continuum maximum and for the northern nucleus 6% of the 2.3 μm continuum maximum). For every panel, the flux is normalized in the zoomed FoV.
Current usage metrics show cumulative count of Article Views (full-text article views including HTML views, PDF and ePub downloads, according to the available data) and Abstracts Views on Vision4Press platform.
Data correspond to usage on the plateform after 2015. The current usage metrics is available 48-96 hours after online publication and is updated daily on week days.
Initial download of the metrics may take a while.