Fig. 5.
Download original image
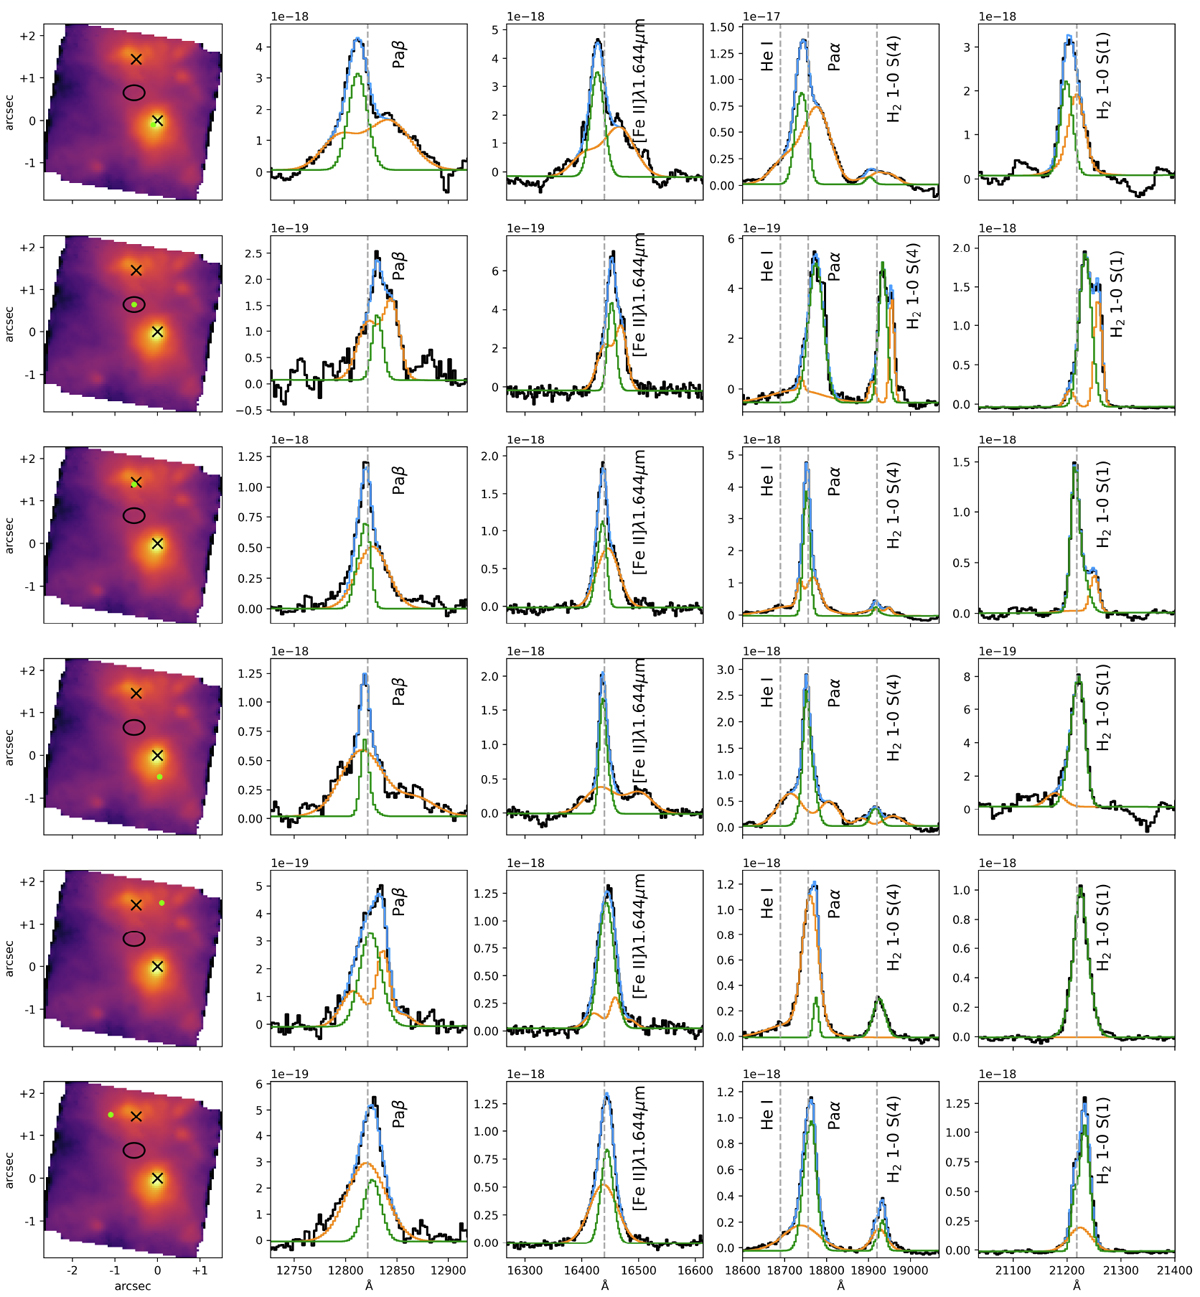
Examples of the decomposition of narrow and broad components at the position of some spaxels. The spaxels are shown with a green point in the left panels (which are Paα maps in logarithmic scale). Black crosses and the black ellipse indicate respectively the nuclei and the high-velocity molecular hydrogen blob positions. The other panels show the results of the decomposition for the Paβ, [Fe II]λ1.644 μm, Paα, H2 1–0 S(4), and H2 1–0 S(1). Black curve shows the observed emission lines after the subtraction of stellar continuum, the blue curve shows the total result of the fit, the green and orange curves mark the narrow and broad components, respectively. The systemic velocity is represented by a gray dashed line. The wavelengths on the x-axis are in the rest-frame. The y-axis units are is erg s−1 cm−2 Å−1.
Current usage metrics show cumulative count of Article Views (full-text article views including HTML views, PDF and ePub downloads, according to the available data) and Abstracts Views on Vision4Press platform.
Data correspond to usage on the plateform after 2015. The current usage metrics is available 48-96 hours after online publication and is updated daily on week days.
Initial download of the metrics may take a while.