Fig. 4.
Download original image
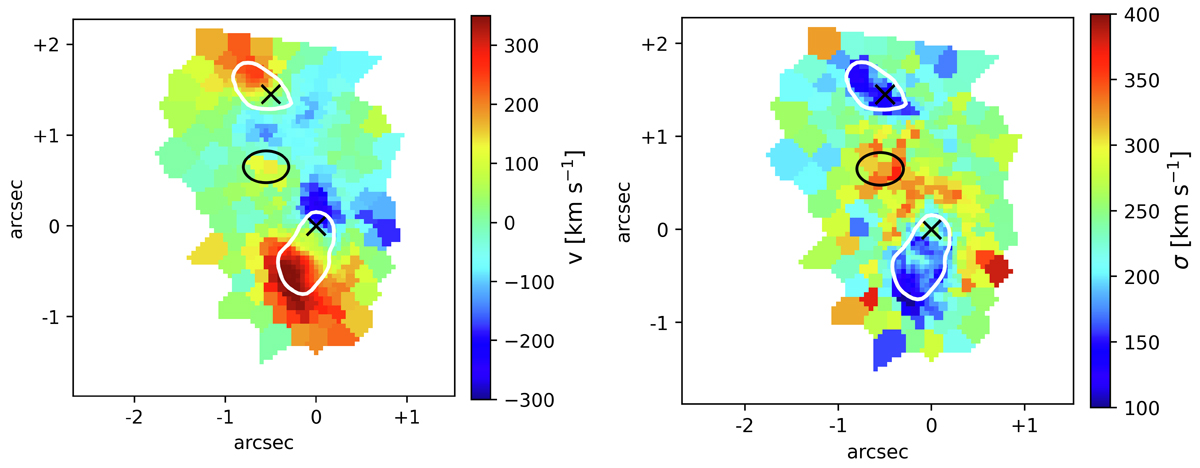
Velocity (left panel) and velocity dispersion (right panel) maps of the stellar component derived from cube2 with the pPXF fitting. White contours tracing continuum are overplotted as a spatial reference (for the southern nucleus we used 19% of the 1.2 μm continuum maximum and for the northern nucleus 6% of the 2.3 μm continuum maximum). Crosses and the ellipse indicate respectively the nuclei and the high-velocity molecular hydrogen blob positions (see Section 4.3.1). From the velocity map, we can distinguish the two stellar rotating disks in the proximity of the two nuclei.
Current usage metrics show cumulative count of Article Views (full-text article views including HTML views, PDF and ePub downloads, according to the available data) and Abstracts Views on Vision4Press platform.
Data correspond to usage on the plateform after 2015. The current usage metrics is available 48-96 hours after online publication and is updated daily on week days.
Initial download of the metrics may take a while.