Fig. 3.
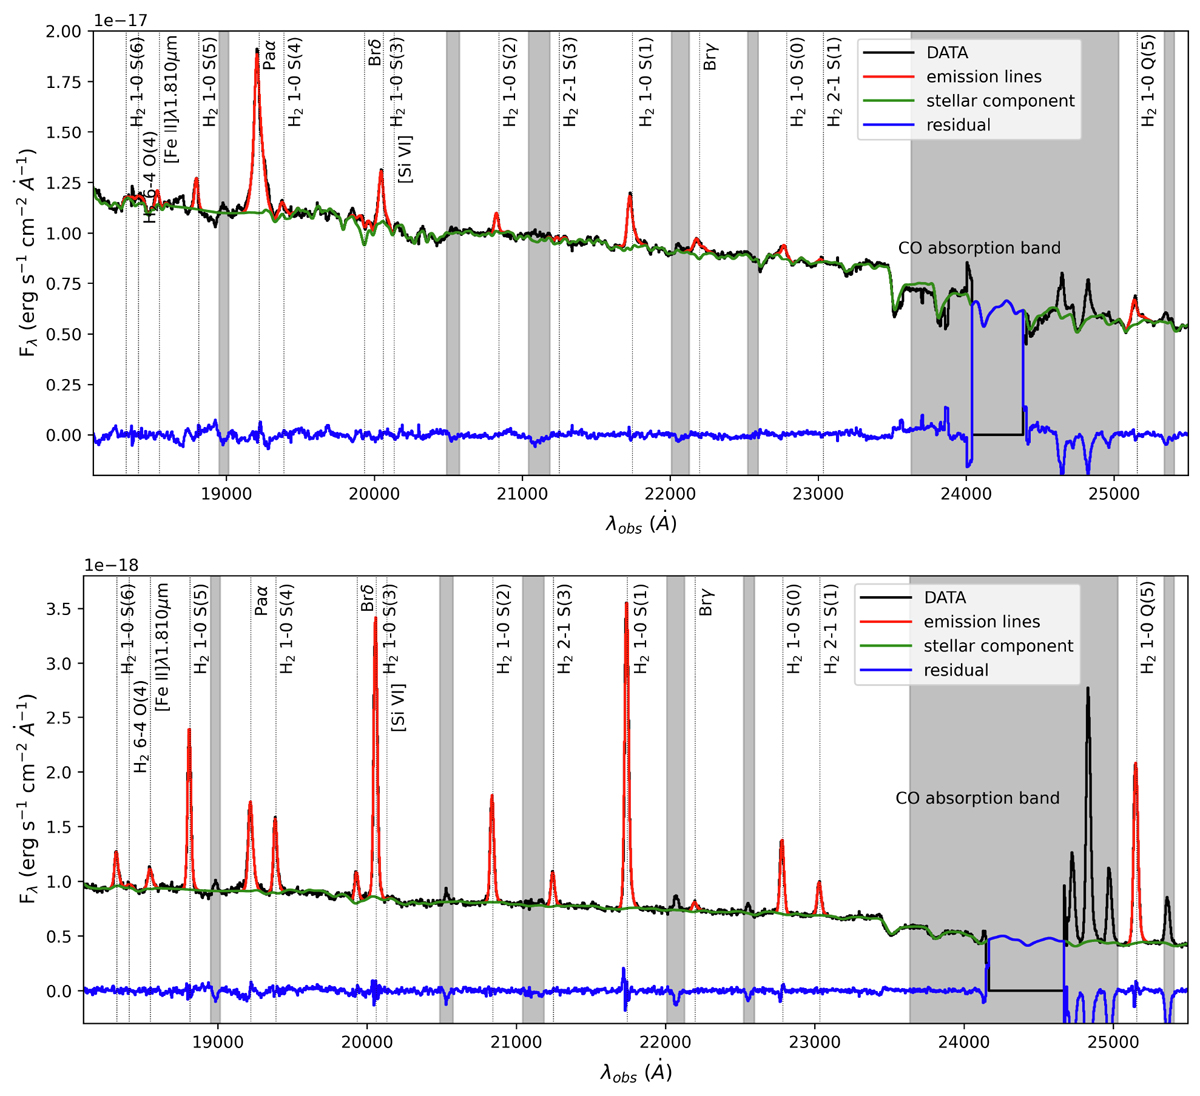
Download original image
Examples of continuum and emission lines fitting in a spaxel from the southern nucleus (top panel) and one from the region between the nuclei (bottom panel) with three Gaussian components for each line. The data, the emission lines model, the stellar model, and the residuals are shown in black, red, green, and blue respectively. Gray bands indicate spectral regions excluded from the fit. Dashed vertical lines mark the emission lines modeled with pPXF fitting (listed in Table 1).
Current usage metrics show cumulative count of Article Views (full-text article views including HTML views, PDF and ePub downloads, according to the available data) and Abstracts Views on Vision4Press platform.
Data correspond to usage on the plateform after 2015. The current usage metrics is available 48-96 hours after online publication and is updated daily on week days.
Initial download of the metrics may take a while.