Fig. 22.
Download original image
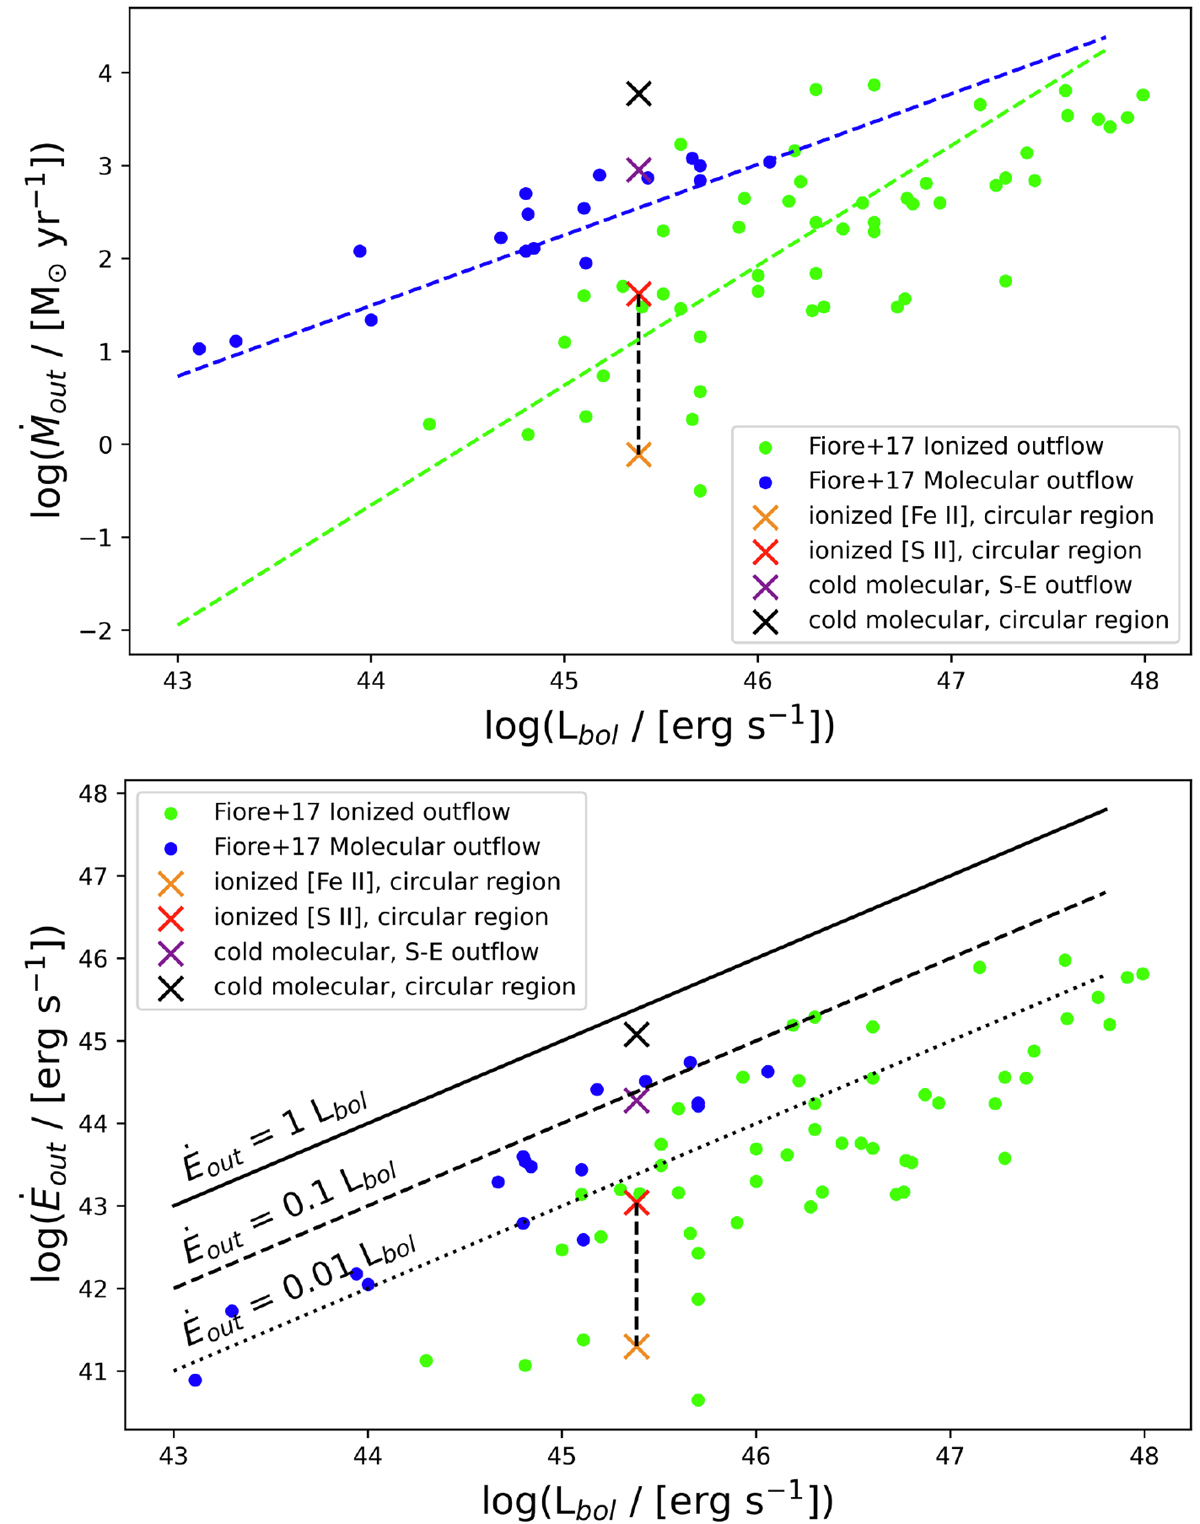
Outflow energetics relations compared with the literature. Top panel: Mass outflow rate as a function of the AGN bolometric luminosity. Green points and green dashed line are the outflow values and correlation for the ionized gas from Fiore et al. (2017), while blue points and blue dashed line are those for the molecular gas. Black cross is the cold molecular outflow in the circular region and purple cross that in the SE outflow. Orange and red crosses are the ionized outflow in the circular region computed with the [Fe II] method and the [S II] method, respectively. Bottom panel: Outflow power as a function of the AGN bolometric luminosity. Solid, dashed and dotted line represent the correlations Ėout = 1, 0.1, 0.01 Lbol.
Current usage metrics show cumulative count of Article Views (full-text article views including HTML views, PDF and ePub downloads, according to the available data) and Abstracts Views on Vision4Press platform.
Data correspond to usage on the plateform after 2015. The current usage metrics is available 48-96 hours after online publication and is updated daily on week days.
Initial download of the metrics may take a while.