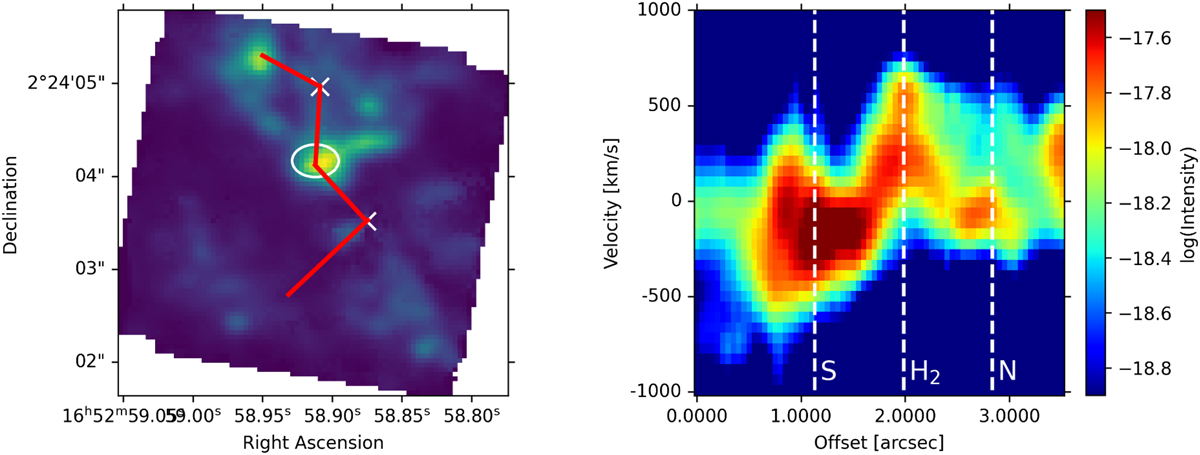
Fig. 21.
Download original image
Position-velocity diagram on the H2 1–0 S(1) emission. Left panel: Velocity channel map of H2 1–0 S(1) of ∼400 km s−1. In red we show the path used in the p–v diagram in the right panel. Crosses and the ellipse indicate respectively the nuclei and the high-velocity molecular hydrogen blob positions. Right panel: Position-velocity diagram of the H2 1–0 S(1) emission line. Vertical dashed lines indicate the position of the landmarks along the path (S is the southern nucleus, H2 is the molecular blob, and N is the northern nucleus). The flux is in log scale.
Current usage metrics show cumulative count of Article Views (full-text article views including HTML views, PDF and ePub downloads, according to the available data) and Abstracts Views on Vision4Press platform.
Data correspond to usage on the plateform after 2015. The current usage metrics is available 48-96 hours after online publication and is updated daily on week days.
Initial download of the metrics may take a while.