Fig. 19.
Download original image
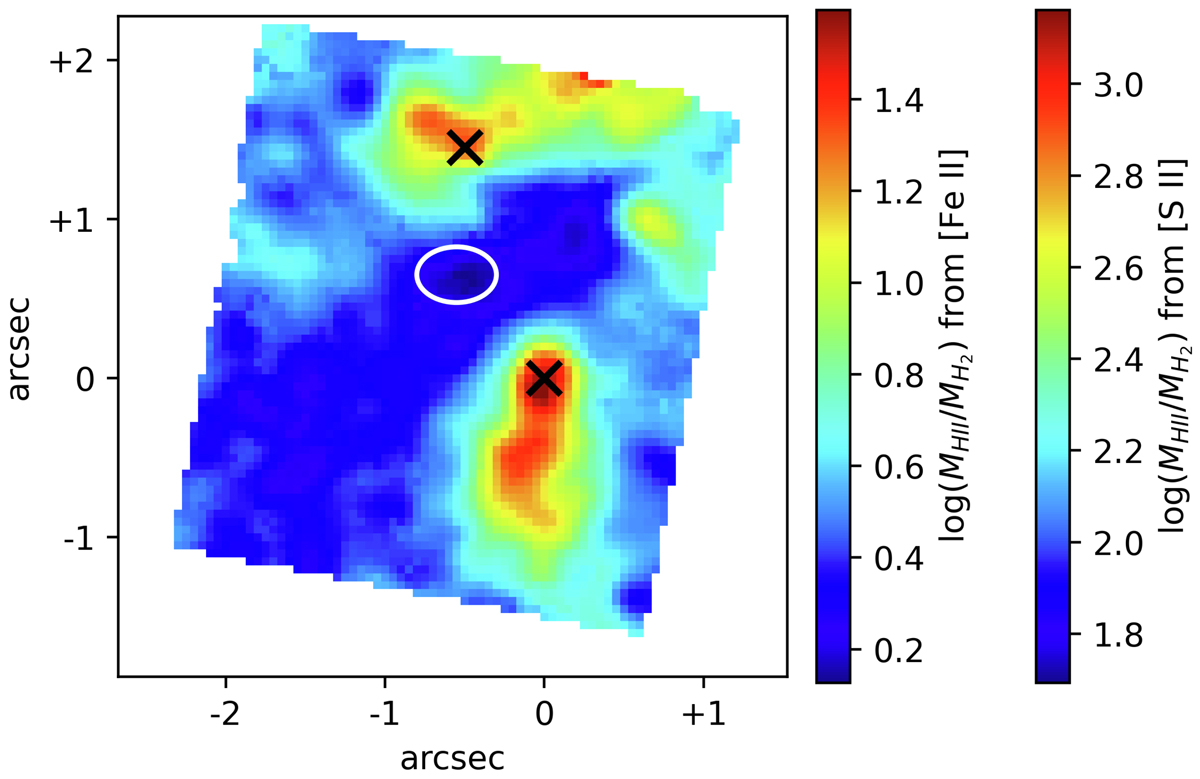
Logarithm ratio between the ionized gas mass and the hot molecular gas mass. The color bars depict the two values obtained with different proxy for the density estimation, namely [Fe II] and [S II] line ratios (see text for details). Crosses and the ellipse indicate respectively the nuclei and the high-velocity molecular hydrogen blob positions.
Current usage metrics show cumulative count of Article Views (full-text article views including HTML views, PDF and ePub downloads, according to the available data) and Abstracts Views on Vision4Press platform.
Data correspond to usage on the plateform after 2015. The current usage metrics is available 48-96 hours after online publication and is updated daily on week days.
Initial download of the metrics may take a while.