Fig. 16.
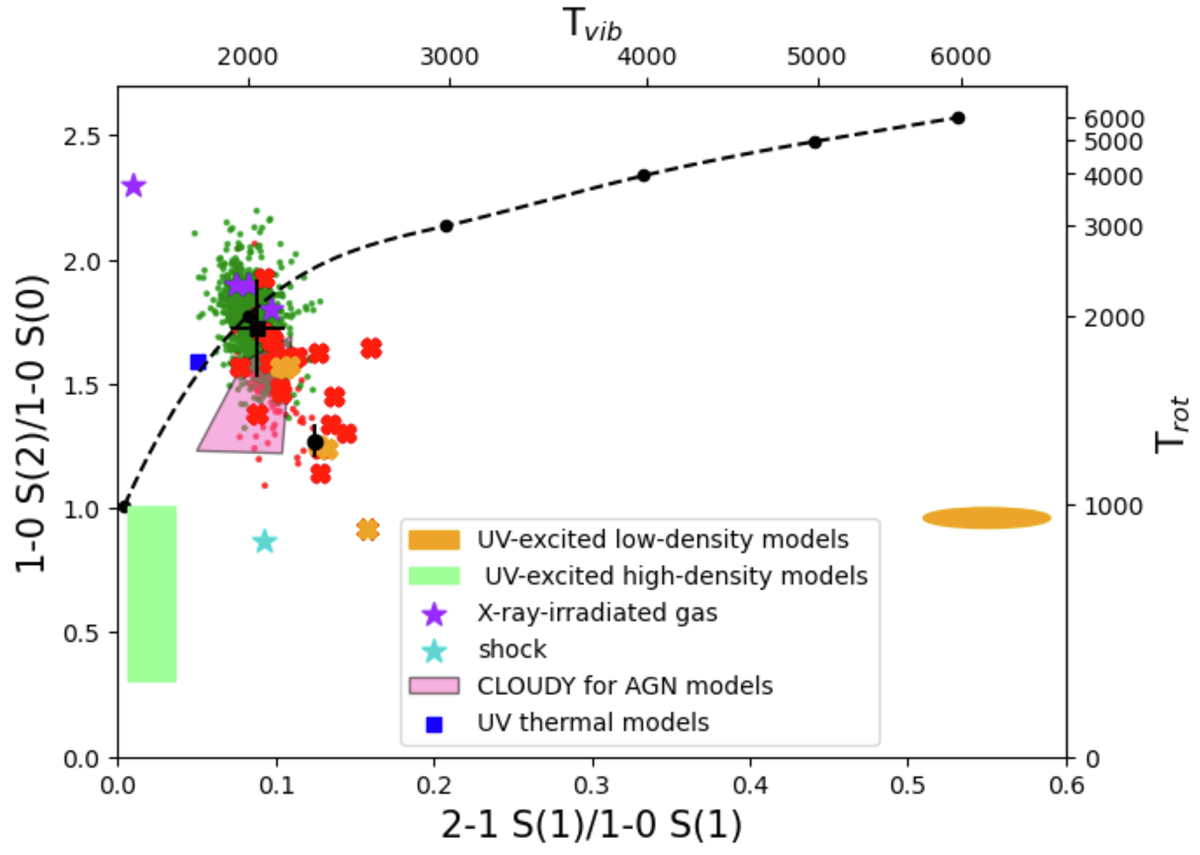
Download original image
H2 excitation diagram. Green and red points are respectively the shock/LINER-dominated and the AGN-dominated spaxels (from Section 4.2.1). Red and orange crosses represent the rebinning regions near the southern and northern nuclei. Black square with error bars are the median and the standard deviation of all these points. Black circle with error bars are derived from the estimation of Trot and Tvib by Riffel et al. (2021) integrating NGC 6240 data in a slightly wider FoV. Black dashed curve represents the thermal emission and on the secondary axis, we have Trot and Tvib. Each point on the curve represents temperatures from 1000 to 6000 K, in steps of 1000 K, from left to right. The orange ellipse represents the region occupied by non-thermal UV excitation models of Black & van Dishoeck (1987) and the pink polygon covers the region of the photoionization code CLOUDY for AGN models of Dors et al. (2012). The green filled rectangle covers the locus of the thermal UV excitation models of Sternberg & Dalgarno (1989). The filled blue squares are the UV thermal models from Davies et al. (2003). The purple stars are models of X-ray-irradiated gas from Lepp & McCray (1983) and Draine & Woods (1990) and the cyan star is from the shock model of Kwan et al. (1977).
Current usage metrics show cumulative count of Article Views (full-text article views including HTML views, PDF and ePub downloads, according to the available data) and Abstracts Views on Vision4Press platform.
Data correspond to usage on the plateform after 2015. The current usage metrics is available 48-96 hours after online publication and is updated daily on week days.
Initial download of the metrics may take a while.