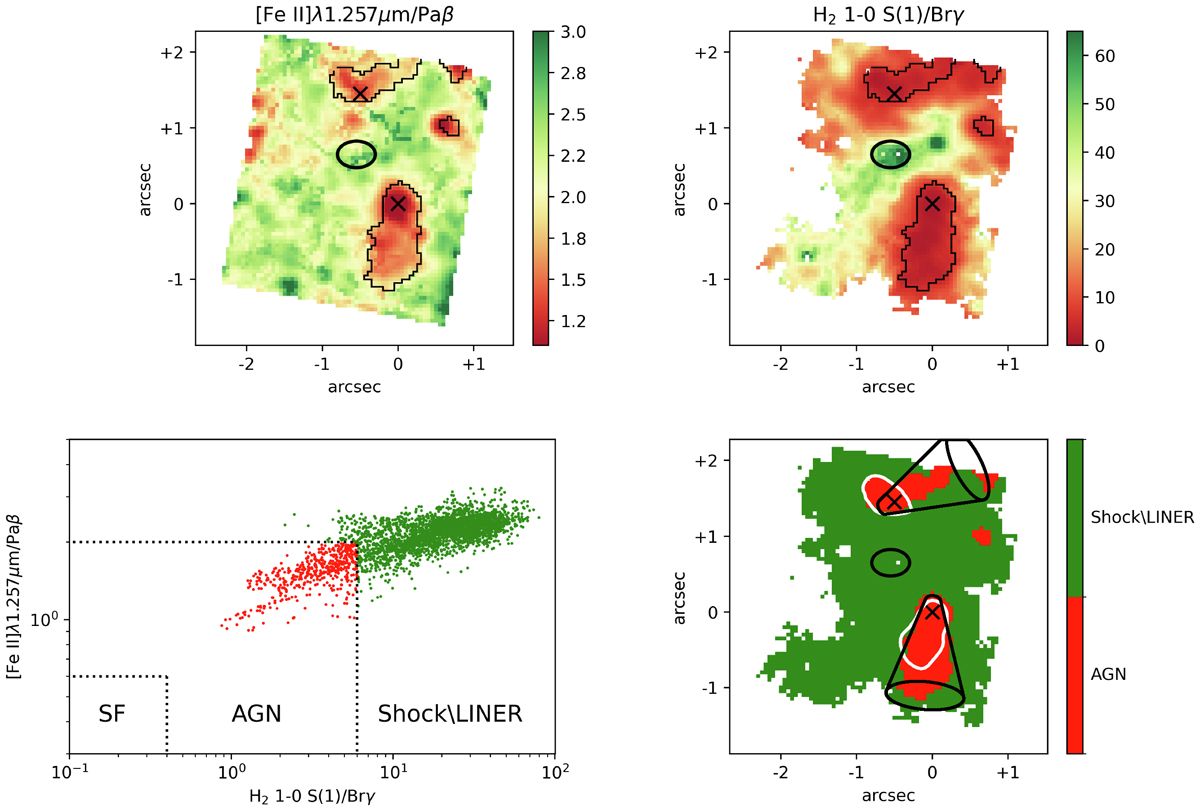
Fig. 13.
Download original image
Line ratio maps and diagnostic diagram for NIR emission lines. Top panels: [Fe II]λ1.257 μm/Paβ and H2 1–0 S(1)/Brγ maps. Black contours delimit AGN-excited spaxels. Bottom-left panel: NIR diagnostic diagram. The dotted lines are the limit values dividing SF-, AGN-, and shock/LINER-excitation (see text for details). No SF-excitation points are detected. Bottom-right panel: Excitation map color coded according to the diagnostic diagram. Shock/LINER-excited spaxels are in green, and AGN-excited spaxels in red. Crosses and the ellipse indicate respectively the nuclei and the high-velocity molecular hydrogen blob positions. White contours are the same as those in Fig. 6, and indicate the regions where most of the continuum emission originates. Black cones indicate the approximate position of the two ionization cones. We used a S/N threshold of three, due to faint Brγ emission.
Current usage metrics show cumulative count of Article Views (full-text article views including HTML views, PDF and ePub downloads, according to the available data) and Abstracts Views on Vision4Press platform.
Data correspond to usage on the plateform after 2015. The current usage metrics is available 48-96 hours after online publication and is updated daily on week days.
Initial download of the metrics may take a while.