Fig. 12.
Download original image
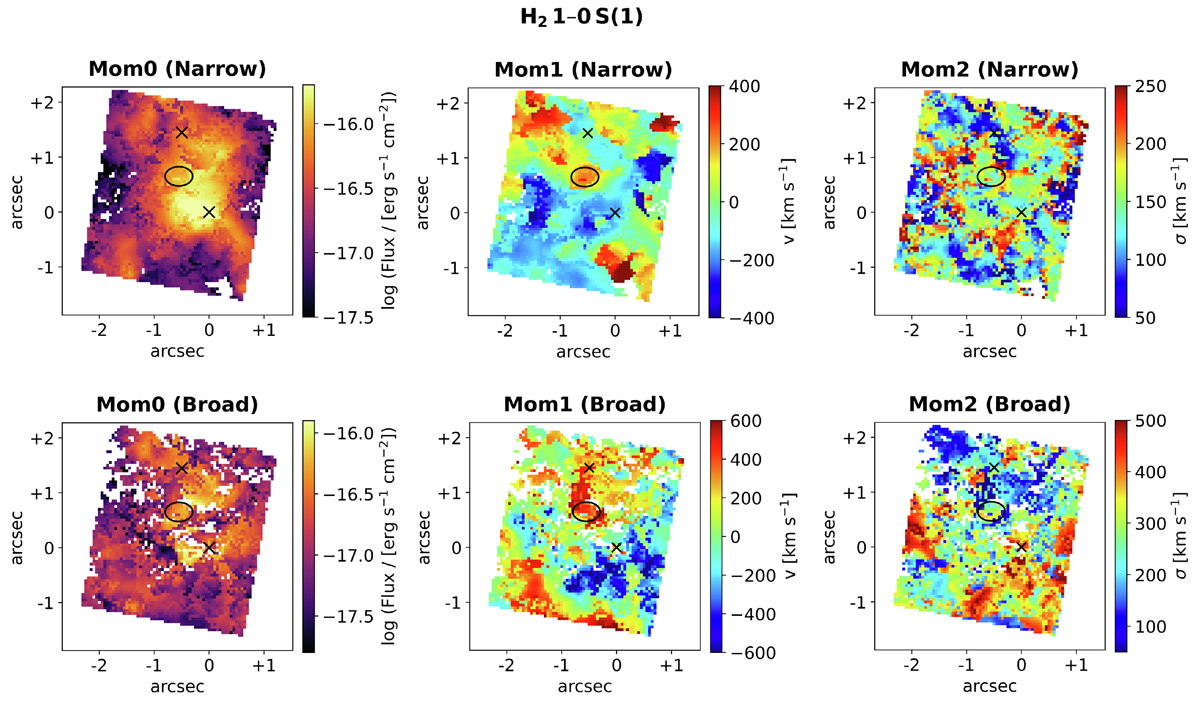
Moment maps of H2 1–0 S(1) narrow and broad components. The panels in the upper (lower) row correspond to the moment maps for the flux, velocity, and velocity dispersion of the narrow (broad) component. Crosses and the ellipse indicate respectively the nuclei and the high-velocity molecular hydrogen blob positions. We masked spaxels with S/N < 5.
Current usage metrics show cumulative count of Article Views (full-text article views including HTML views, PDF and ePub downloads, according to the available data) and Abstracts Views on Vision4Press platform.
Data correspond to usage on the plateform after 2015. The current usage metrics is available 48-96 hours after online publication and is updated daily on week days.
Initial download of the metrics may take a while.