Open Access
Fig. 11.
Download original image
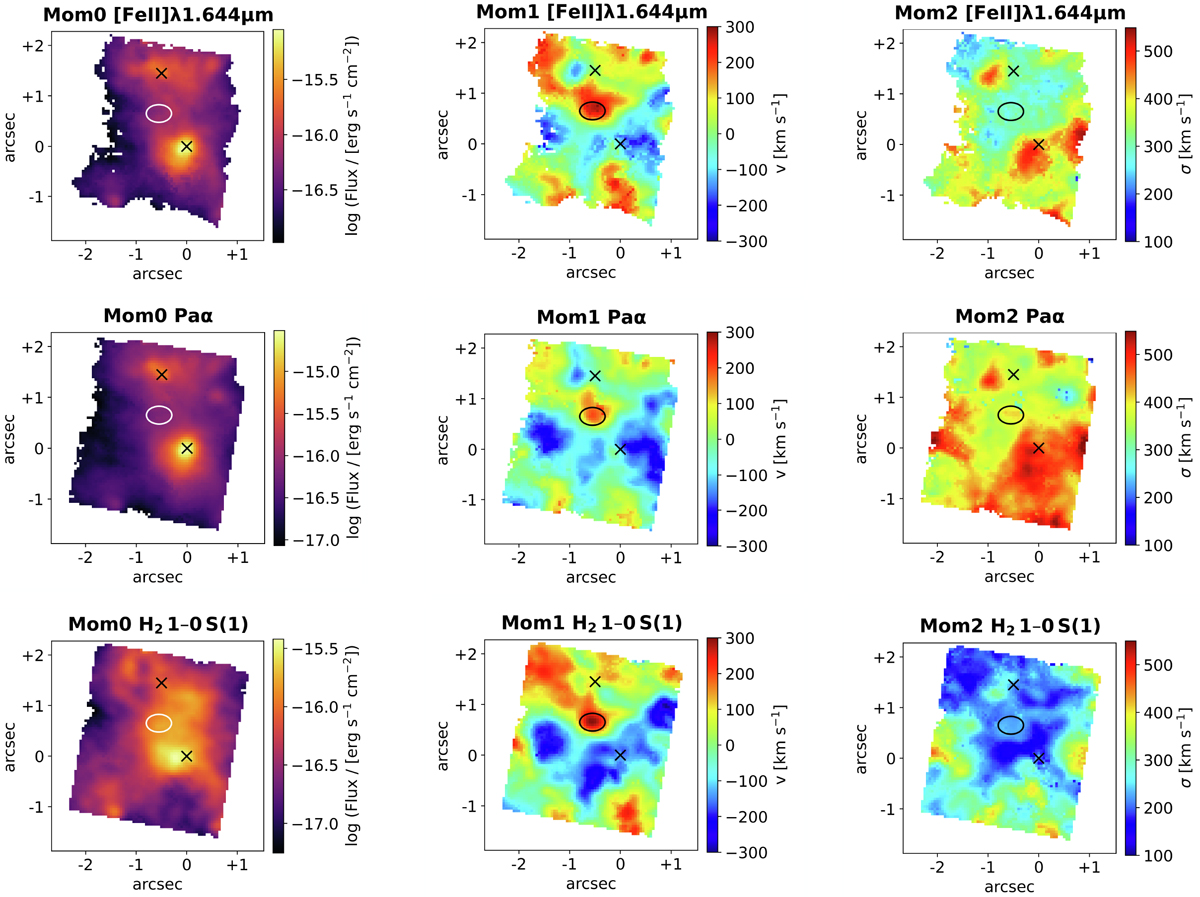
Moment maps of [Fe II]λ1.644 μm, Paα, and H2 1–0 S(1) total emission lines with a threshold of S/N > 15. From left to right, we plot the flux map, the velocity map, and the velocity dispersion map. Crosses and the ellipse indicate, respectively, the nuclei and the high-velocity molecular hydrogen blob positions.
Current usage metrics show cumulative count of Article Views (full-text article views including HTML views, PDF and ePub downloads, according to the available data) and Abstracts Views on Vision4Press platform.
Data correspond to usage on the plateform after 2015. The current usage metrics is available 48-96 hours after online publication and is updated daily on week days.
Initial download of the metrics may take a while.