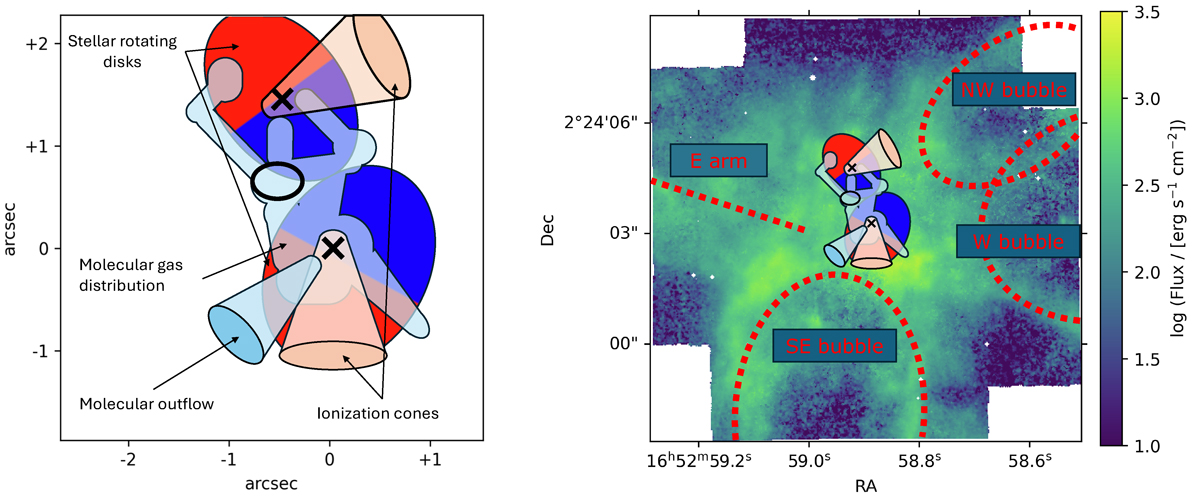
Fig. 10.
Download original image
Main kinematical features and gas distribution observed in the NIRSpec FoV (left panel), over-imposed on the flux map of Hα from NFM MUSE data (right panel) with schematic identification of arms and bubbles already known from the literature. The two ellipses indicate the rotating disk of stars, where the approaching region is in blue and the receding one is in red (Section 3.1). The molecular gas distribution is shown in light blue (Sections 4.1 and 4.3.1). The ionization cones of the two AGN (Sections 4.2.1 and 4.2.2) are indicated in orange. The light blue cone represents the molecular outflow near the southern nucleus (Section 4.3.1). Black crosses and the black ellipse indicate respectively the nuclei and the high-velocity molecular hydrogen blob positions.
Current usage metrics show cumulative count of Article Views (full-text article views including HTML views, PDF and ePub downloads, according to the available data) and Abstracts Views on Vision4Press platform.
Data correspond to usage on the plateform after 2015. The current usage metrics is available 48-96 hours after online publication and is updated daily on week days.
Initial download of the metrics may take a while.