Fig. 1.
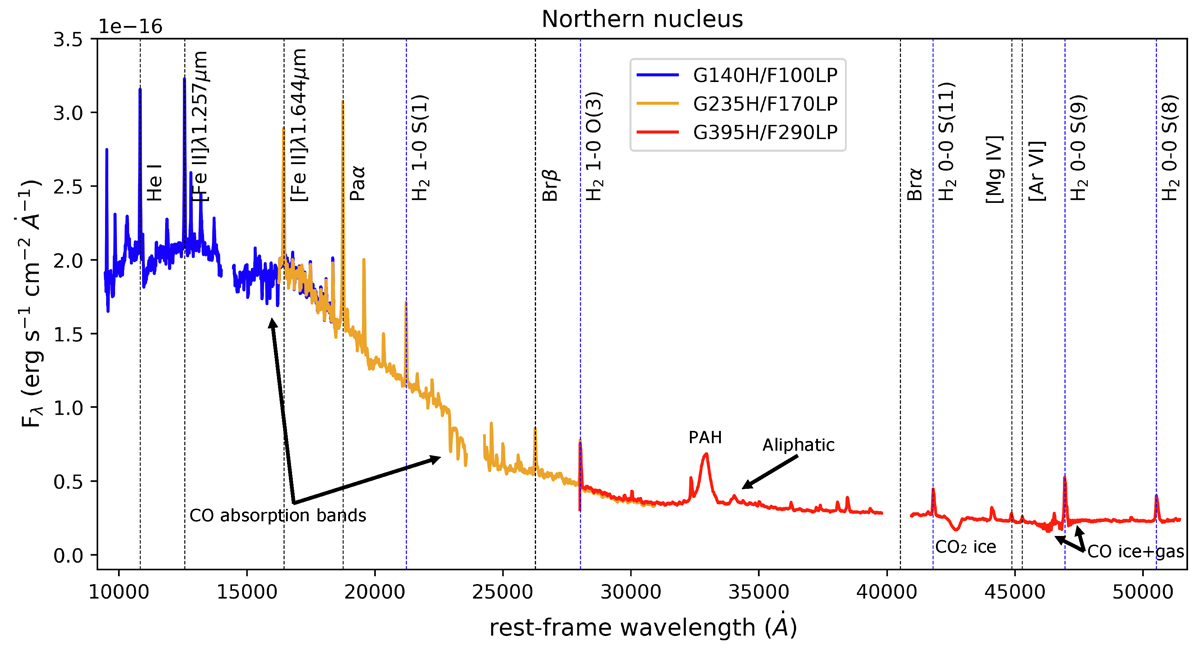
Download original image
Spectrum of the northern nucleus, integrated over an aperture of 5-spaxel radius (r = 0.25″ corresponding to ∼130 pc). The blue curve is the spectrum from G140H/F100LP (cube1), the orange one from G235H/F170LP (cube2), and the red one from G395H/F290LP (cube3). Each cube spectrum shows a discontinuity in the middle of the band, which is due to the gap between the NIRSpec detectors. We indicated the brightest emission lines with vertical dashed lines (in blue those of molecular hydrogen, in black the others) and the more noticeable features, as the CO absorption bands, polycyclic aromatic hydrocarbons (PAH) and aliphatic emission, and CO2 ice absorption.
Current usage metrics show cumulative count of Article Views (full-text article views including HTML views, PDF and ePub downloads, according to the available data) and Abstracts Views on Vision4Press platform.
Data correspond to usage on the plateform after 2015. The current usage metrics is available 48-96 hours after online publication and is updated daily on week days.
Initial download of the metrics may take a while.