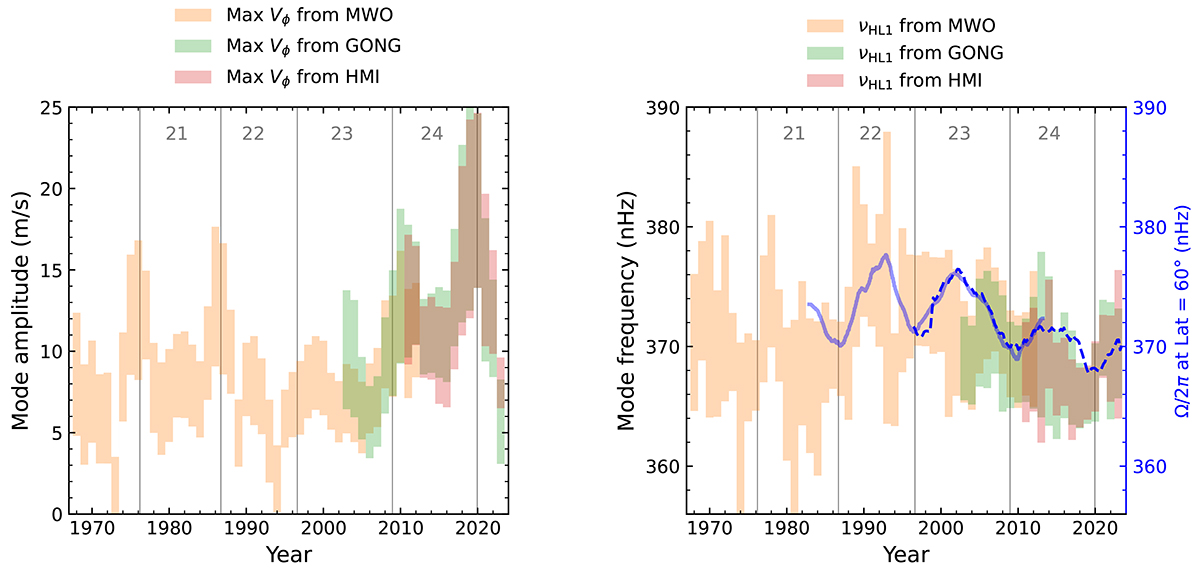
Fig. 9.
Download original image
Temporal variation of the mode amplitude (left) and frequency (right) taken from Fig. 7, together with surface rotation rates at 60° latitude obtained from MWO Doppler velocity (1983–2013) in solid light blue, and from global helioseismology using MDI (1996–2010) and HMI (2010–2023) data in dashed blue. The beginnings of cycles 21–25 (solar minima) are marked with vertical lines and the cycle numbers are denoted at the top.
Current usage metrics show cumulative count of Article Views (full-text article views including HTML views, PDF and ePub downloads, according to the available data) and Abstracts Views on Vision4Press platform.
Data correspond to usage on the plateform after 2015. The current usage metrics is available 48-96 hours after online publication and is updated daily on week days.
Initial download of the metrics may take a while.