Fig. 8.
Download original image
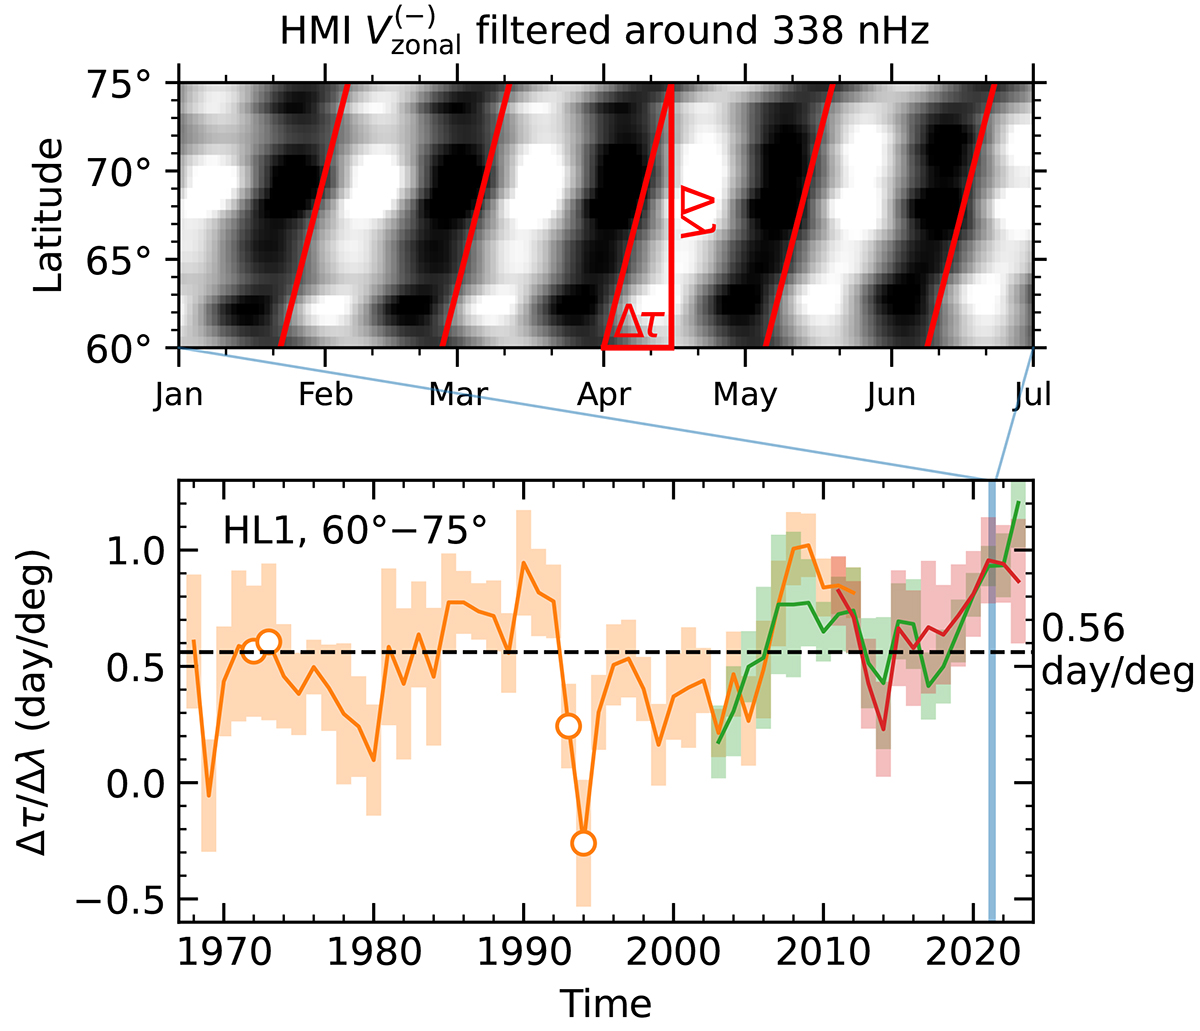
Temporal variations of HL1 mode velocity pattern. Top: HMI ![]() in the first half of 2021 applied with a band-pass filter around
in the first half of 2021 applied with a band-pass filter around ![]() . The slope of the striped pattern in
. The slope of the striped pattern in ![]() is highlighted by the tilted red lines. The Δτ (time lag) and Δλ (latitudinal separation) that determine the slope of the striped pattern Δτ/Δλ are indicated in the plot (the two legs of the red right triangle). Bottom: Δτ/Δλ as a function of time, using the same color conventions as in Fig. 7.
is highlighted by the tilted red lines. The Δτ (time lag) and Δλ (latitudinal separation) that determine the slope of the striped pattern Δτ/Δλ are indicated in the plot (the two legs of the red right triangle). Bottom: Δτ/Δλ as a function of time, using the same color conventions as in Fig. 7.
Current usage metrics show cumulative count of Article Views (full-text article views including HTML views, PDF and ePub downloads, according to the available data) and Abstracts Views on Vision4Press platform.
Data correspond to usage on the plateform after 2015. The current usage metrics is available 48-96 hours after online publication and is updated daily on week days.
Initial download of the metrics may take a while.