Fig. 7.
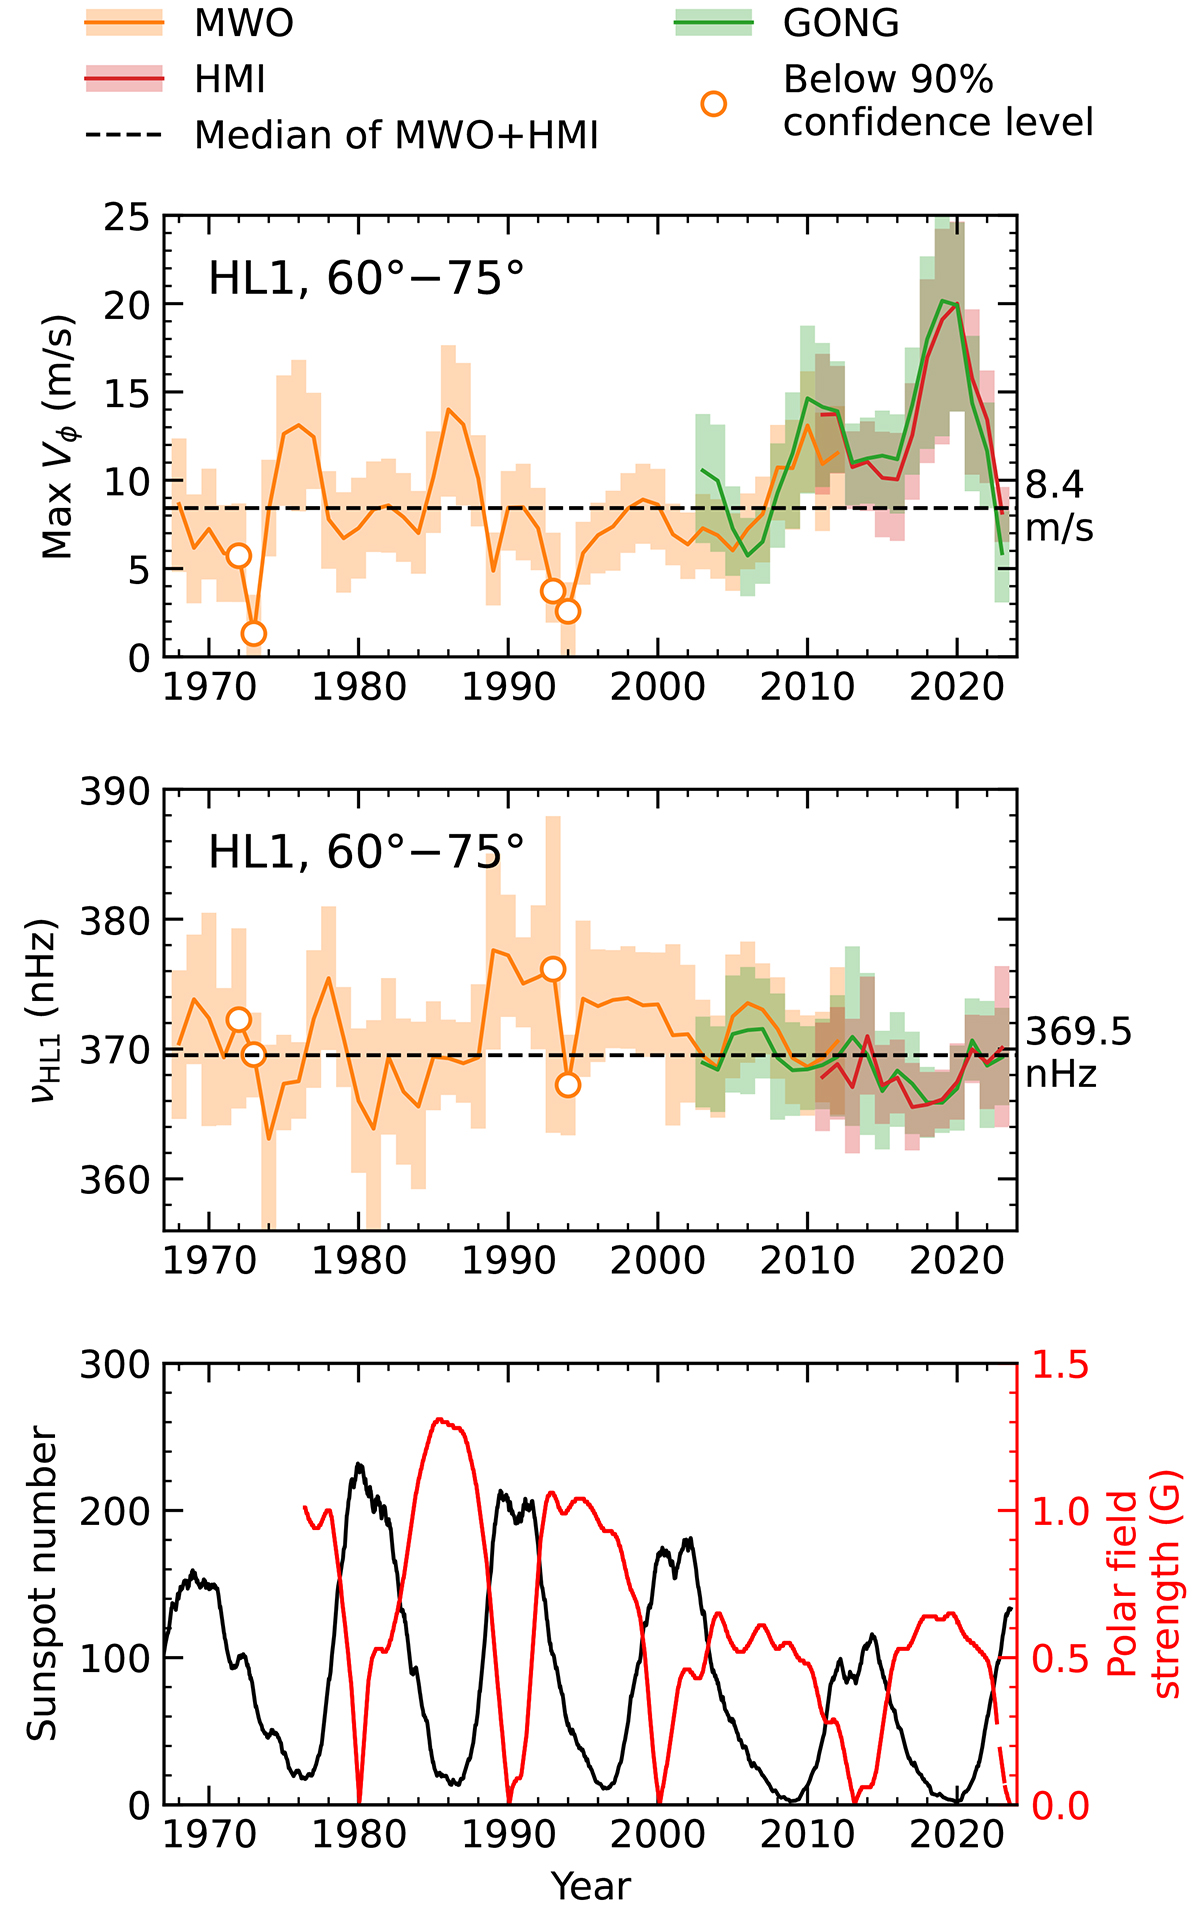
Download original image
Temporal variations of the amplitude (top panel) and frequency (middle panel) of the HL1 mode, together with the sunspot number and the polar field strength (bottom panel). The orange, green, and red solid curves show the results from MWO, GONG, and HMI data sets, respectively, with the shaded areas showing the 68% confidence interval estimated from 10 000 Monte Carlo simulations. The open circles indicate that the excess power around the mode frequency is below 90% confidence level. The horizontal dashed lines represent the median value over MWO (1968–2010) and HMI (2011–2023) data sets.
Current usage metrics show cumulative count of Article Views (full-text article views including HTML views, PDF and ePub downloads, according to the available data) and Abstracts Views on Vision4Press platform.
Data correspond to usage on the plateform after 2015. The current usage metrics is available 48-96 hours after online publication and is updated daily on week days.
Initial download of the metrics may take a while.