Fig. 6.
Download original image
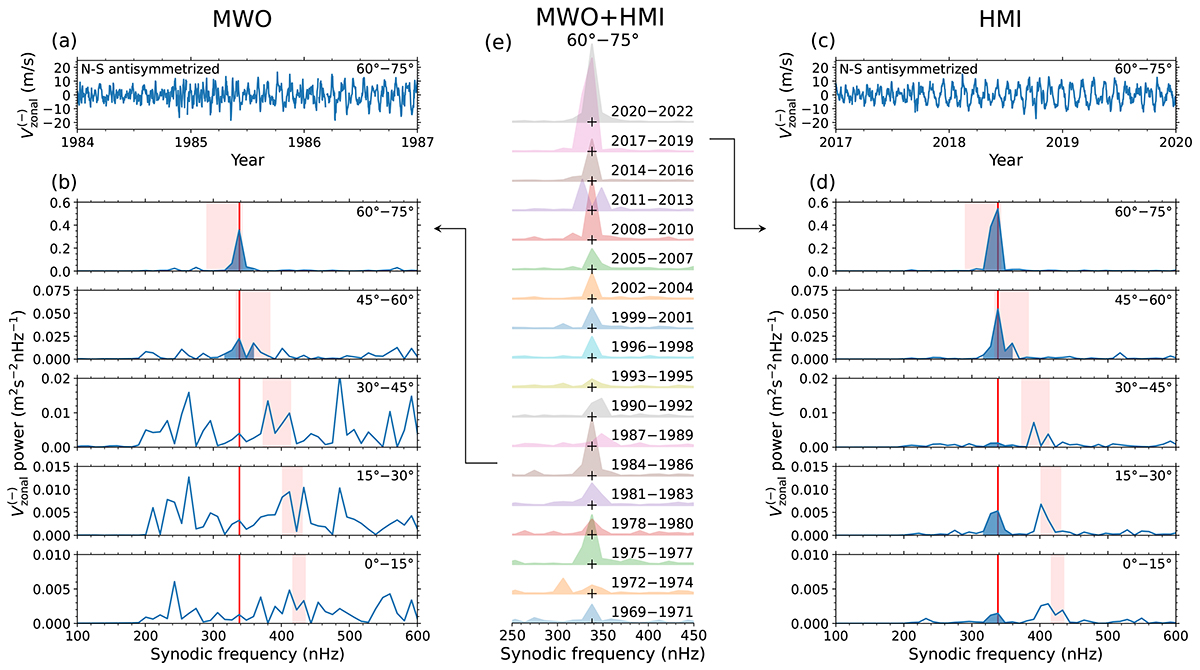
Visibility of HL1 mode in consecutive three-year power spectra, using MWO (1969–2010) and HMI (2011–2022) data. Panel a: example MWO time series (1984–1986) of ![]() averaged over latitudes 60° ≤λ < 75° (i.e.,
averaged over latitudes 60° ≤λ < 75° (i.e., ![]() ). Panel b: power spectra of
). Panel b: power spectra of ![]() for the same time period in various latitudinal bands of 15° (labeled at the top right corner of each panel). The vertical red lines denote the reference HL1 mode frequency
for the same time period in various latitudinal bands of 15° (labeled at the top right corner of each panel). The vertical red lines denote the reference HL1 mode frequency ![]() nHz and the excess power around this frequency is highlighted in blue. The shaded pink areas indicate the differential rotation rate in the outer 5% of the Sun from global helioseismology as viewed from the Earth. Panels c and d: same as above but for an example HMI three-year time series during 2017–2019. Panel e: all available three-year power spectra of
nHz and the excess power around this frequency is highlighted in blue. The shaded pink areas indicate the differential rotation rate in the outer 5% of the Sun from global helioseismology as viewed from the Earth. Panels c and d: same as above but for an example HMI three-year time series during 2017–2019. Panel e: all available three-year power spectra of ![]() stacked on top of each other. The crosses highlight the reference frequency of 338 nHz.
stacked on top of each other. The crosses highlight the reference frequency of 338 nHz.
Current usage metrics show cumulative count of Article Views (full-text article views including HTML views, PDF and ePub downloads, according to the available data) and Abstracts Views on Vision4Press platform.
Data correspond to usage on the plateform after 2015. The current usage metrics is available 48-96 hours after online publication and is updated daily on week days.
Initial download of the metrics may take a while.