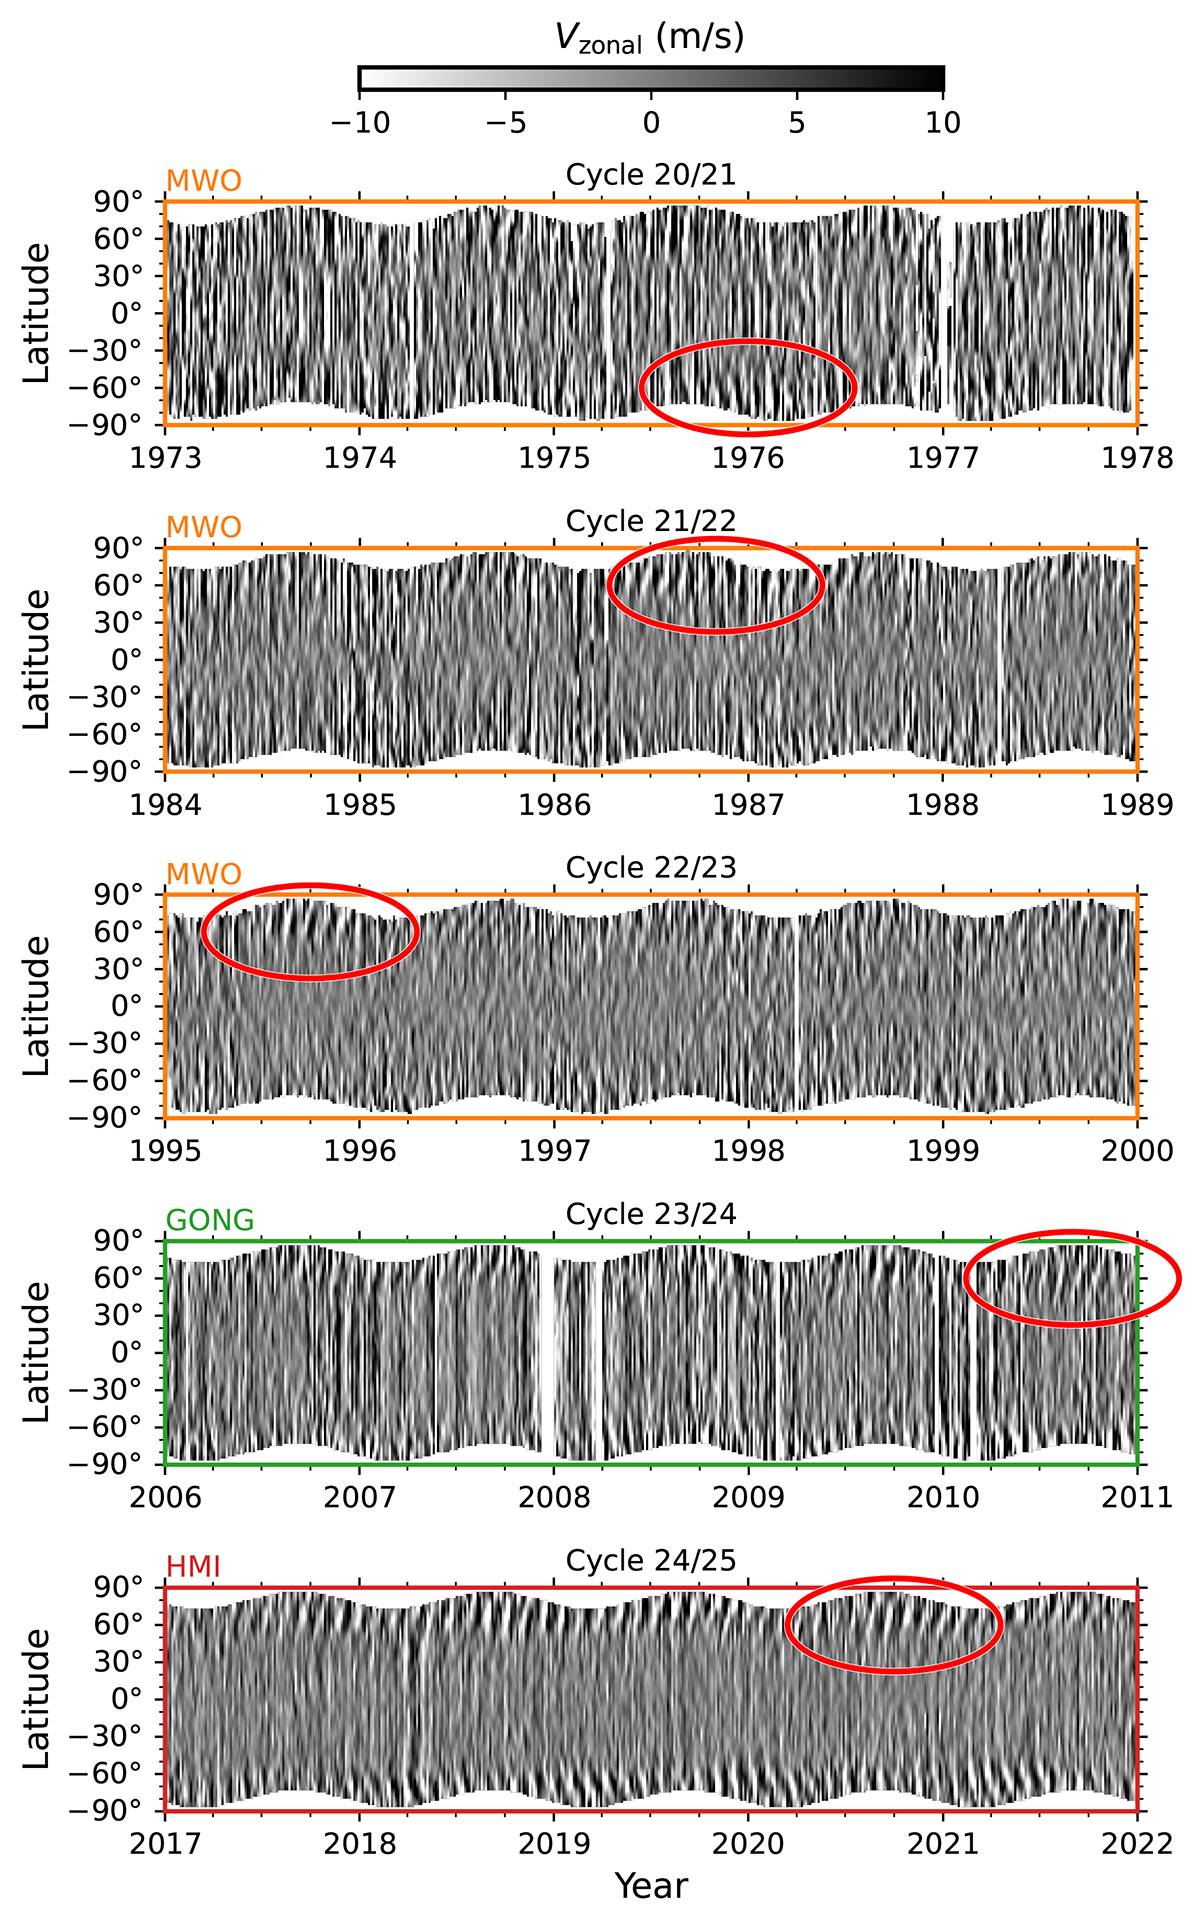
Fig. 2.
Download original image
Example supersynoptic maps of Vzonal in the Earth frame computed from the MWO (top three panels), GONG (fourth panel), and HMI data (bottom panel) near cycle minima. The full data set is shown in Fig. A.2). The HL1 mode may be seen from time to time as stripes in Vzonal above 50° latitude (see regions in red ellipses). For clarity, the maps were smoothed in latitude with a Gaussian kernel of width 10°.
Current usage metrics show cumulative count of Article Views (full-text article views including HTML views, PDF and ePub downloads, according to the available data) and Abstracts Views on Vision4Press platform.
Data correspond to usage on the plateform after 2015. The current usage metrics is available 48-96 hours after online publication and is updated daily on week days.
Initial download of the metrics may take a while.