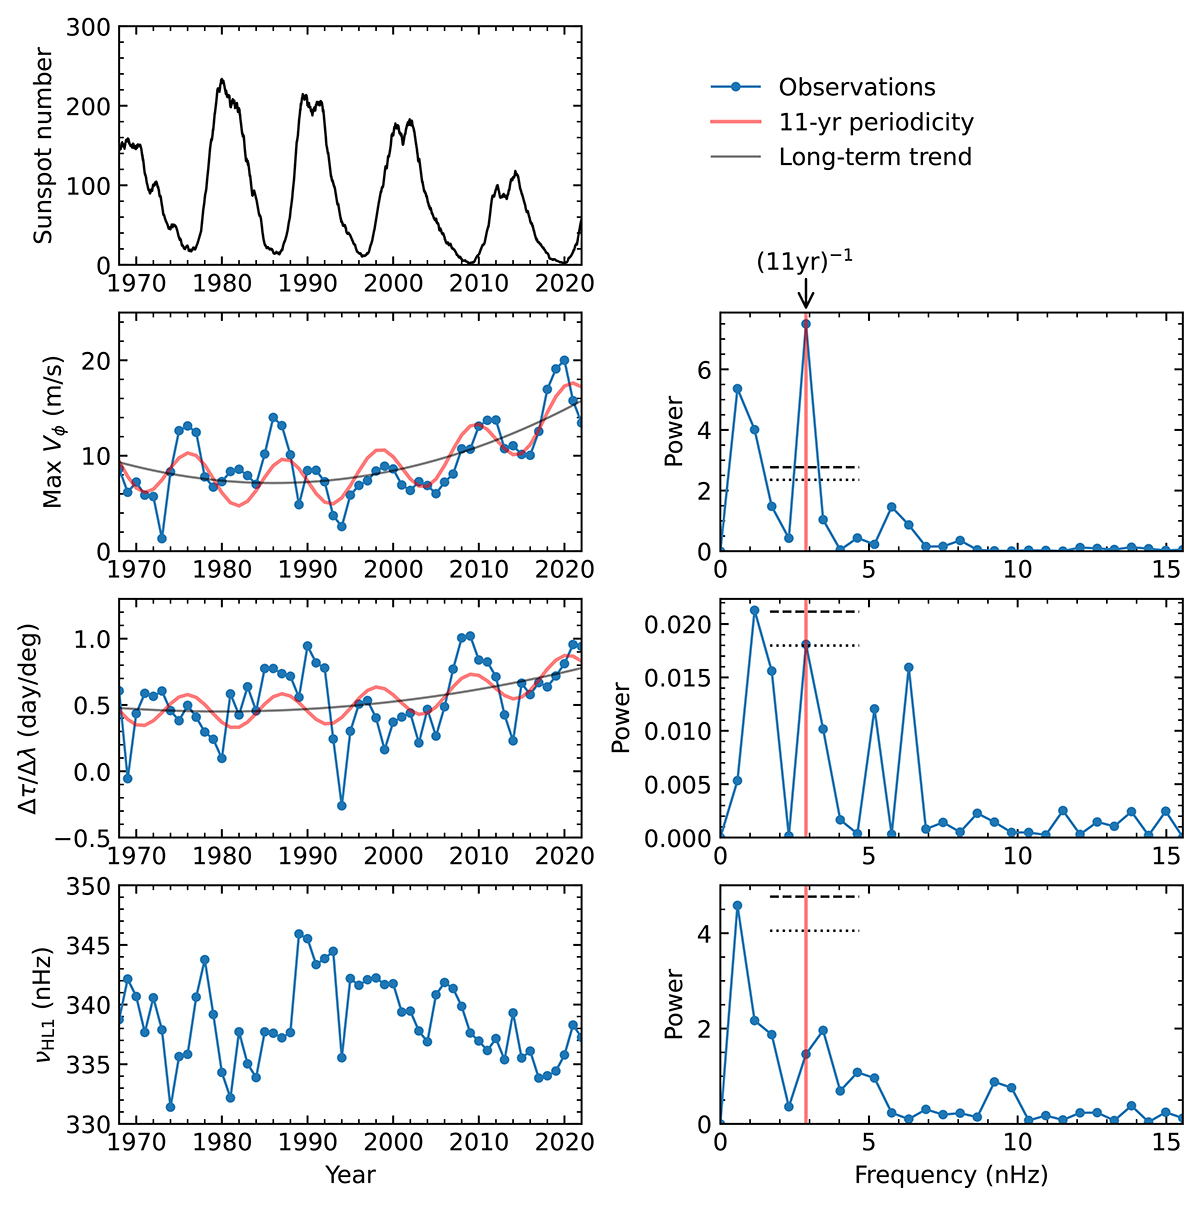
Fig. A.4.
Download original image
Eleven-year periodic components and power spectra of HL1 mode parameters. Left column, from top to bottom: sunspot number, HL1 mode amplitude, eigenfunction tilt, and frequency. The 55-yr long time series combine the MWO (1968 – 2010) and HMI (2011 – 2022) measurements taken from Figs. 7 and 8. The gray curves are fitted parabolas representing the long-term trend. The pink curves show the 11-yr periodicity in the data added to the long-term trend. Right column: power spectra of the time series from the left column with the temporal mean subtracted. The vertical pink lines indicate the frequency of (11yr)−1 = 2.88 nHz that corresponds to the average sunspot cycle period. The horizontal dashed and dotted lines represent the 95% and 90% confidence levels, respectively. The 11-year periodicity is highly significant for the mode amplitude, and only marginally significant for the eigenfunction tilt. No evidence is found for an 11-year periodicity in the mode frequency.
Current usage metrics show cumulative count of Article Views (full-text article views including HTML views, PDF and ePub downloads, according to the available data) and Abstracts Views on Vision4Press platform.
Data correspond to usage on the plateform after 2015. The current usage metrics is available 48-96 hours after online publication and is updated daily on week days.
Initial download of the metrics may take a while.