Fig. A.3.
Download original image
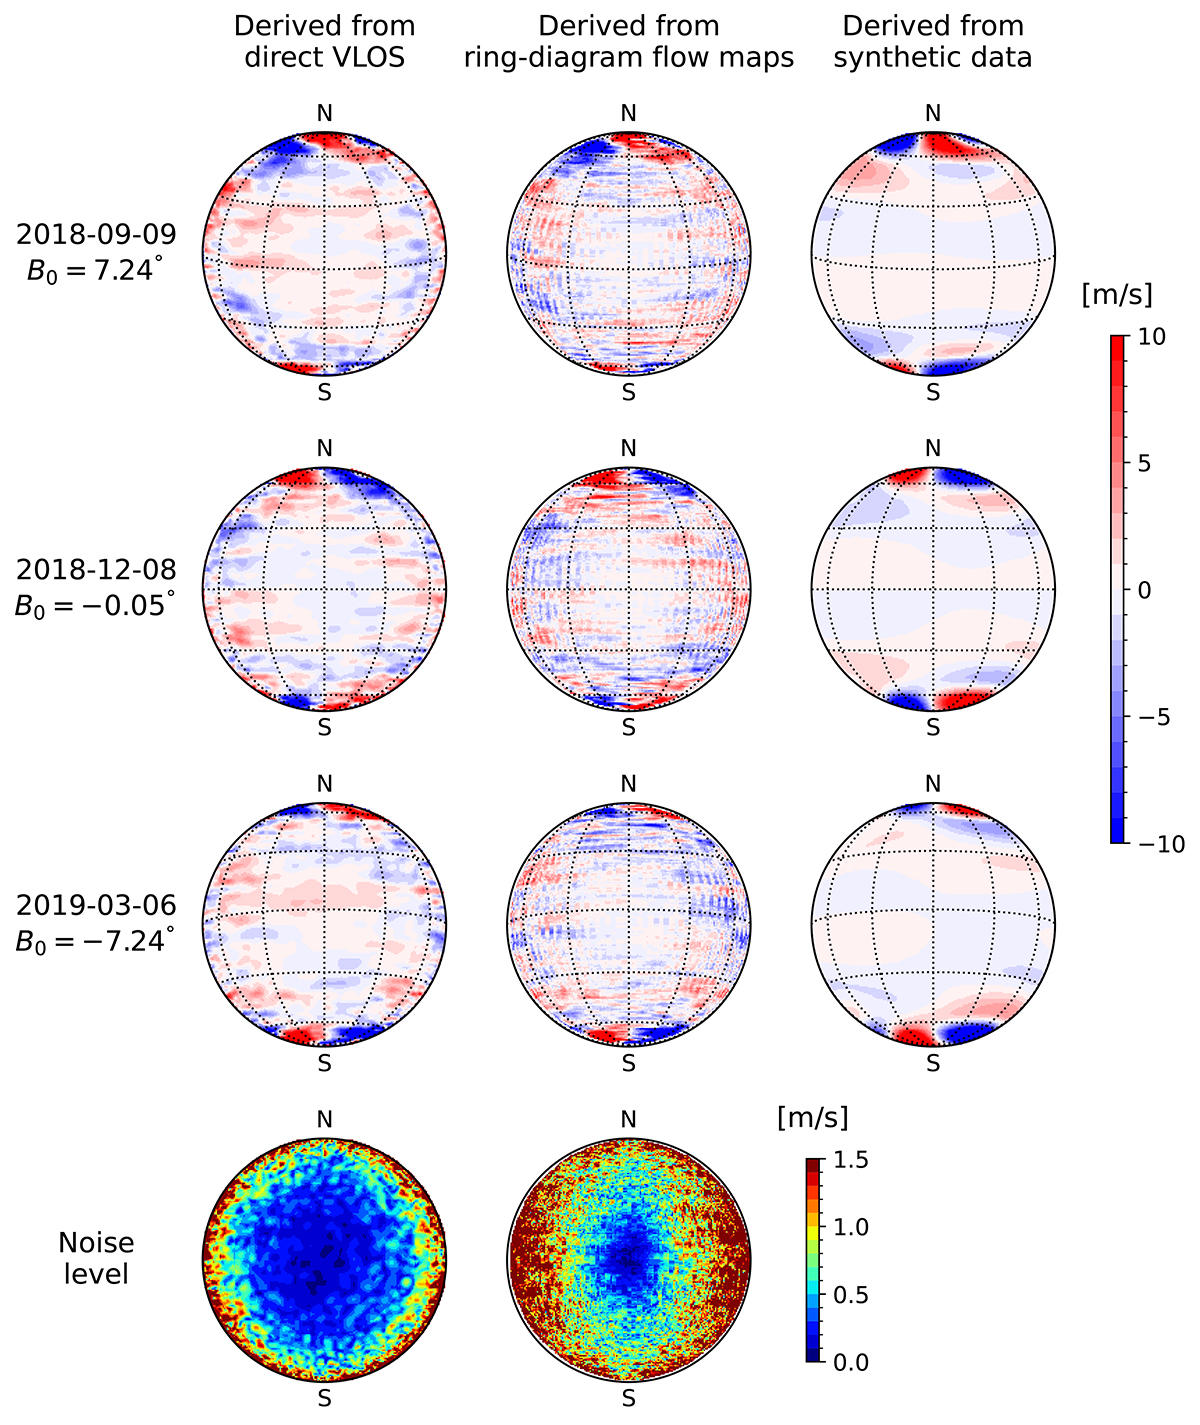
Comparison of the m = 1 high-latitude mode oscillations in the line-of-sight Doppler velocity as viewed from the Earth, obtained using various methods, when the solar tilt angle B0 is 7.24° (top), 0° (middle), and −7.24° (bottom). Left column: observed Doppler velocity Vlos from HMI data band-pass filtered around ![]() (
(![]() , see Eq. (8)). For a better comparison with the middle column, the images were Gaussian smoothed with a FWHM of 5°. Middle column: reconstructed Vlos, obtained by projecting the 5°-tile horizontal flow maps from the HMI ring-diagram analysis onto the line of sight and applying the same filter as in the first column. Right column: line-of-sight projection of mode eigenfunction obtained using a linear eigenvalue solver (Bekki et al. 2022), scaled to an amplitude comparable to the observations. Bottom row: maps of noise in
, see Eq. (8)). For a better comparison with the middle column, the images were Gaussian smoothed with a FWHM of 5°. Middle column: reconstructed Vlos, obtained by projecting the 5°-tile horizontal flow maps from the HMI ring-diagram analysis onto the line of sight and applying the same filter as in the first column. Right column: line-of-sight projection of mode eigenfunction obtained using a linear eigenvalue solver (Bekki et al. 2022), scaled to an amplitude comparable to the observations. Bottom row: maps of noise in ![]() estimated from the temporal variance of the data at each spatial point.
estimated from the temporal variance of the data at each spatial point.
Current usage metrics show cumulative count of Article Views (full-text article views including HTML views, PDF and ePub downloads, according to the available data) and Abstracts Views on Vision4Press platform.
Data correspond to usage on the plateform after 2015. The current usage metrics is available 48-96 hours after online publication and is updated daily on week days.
Initial download of the metrics may take a while.