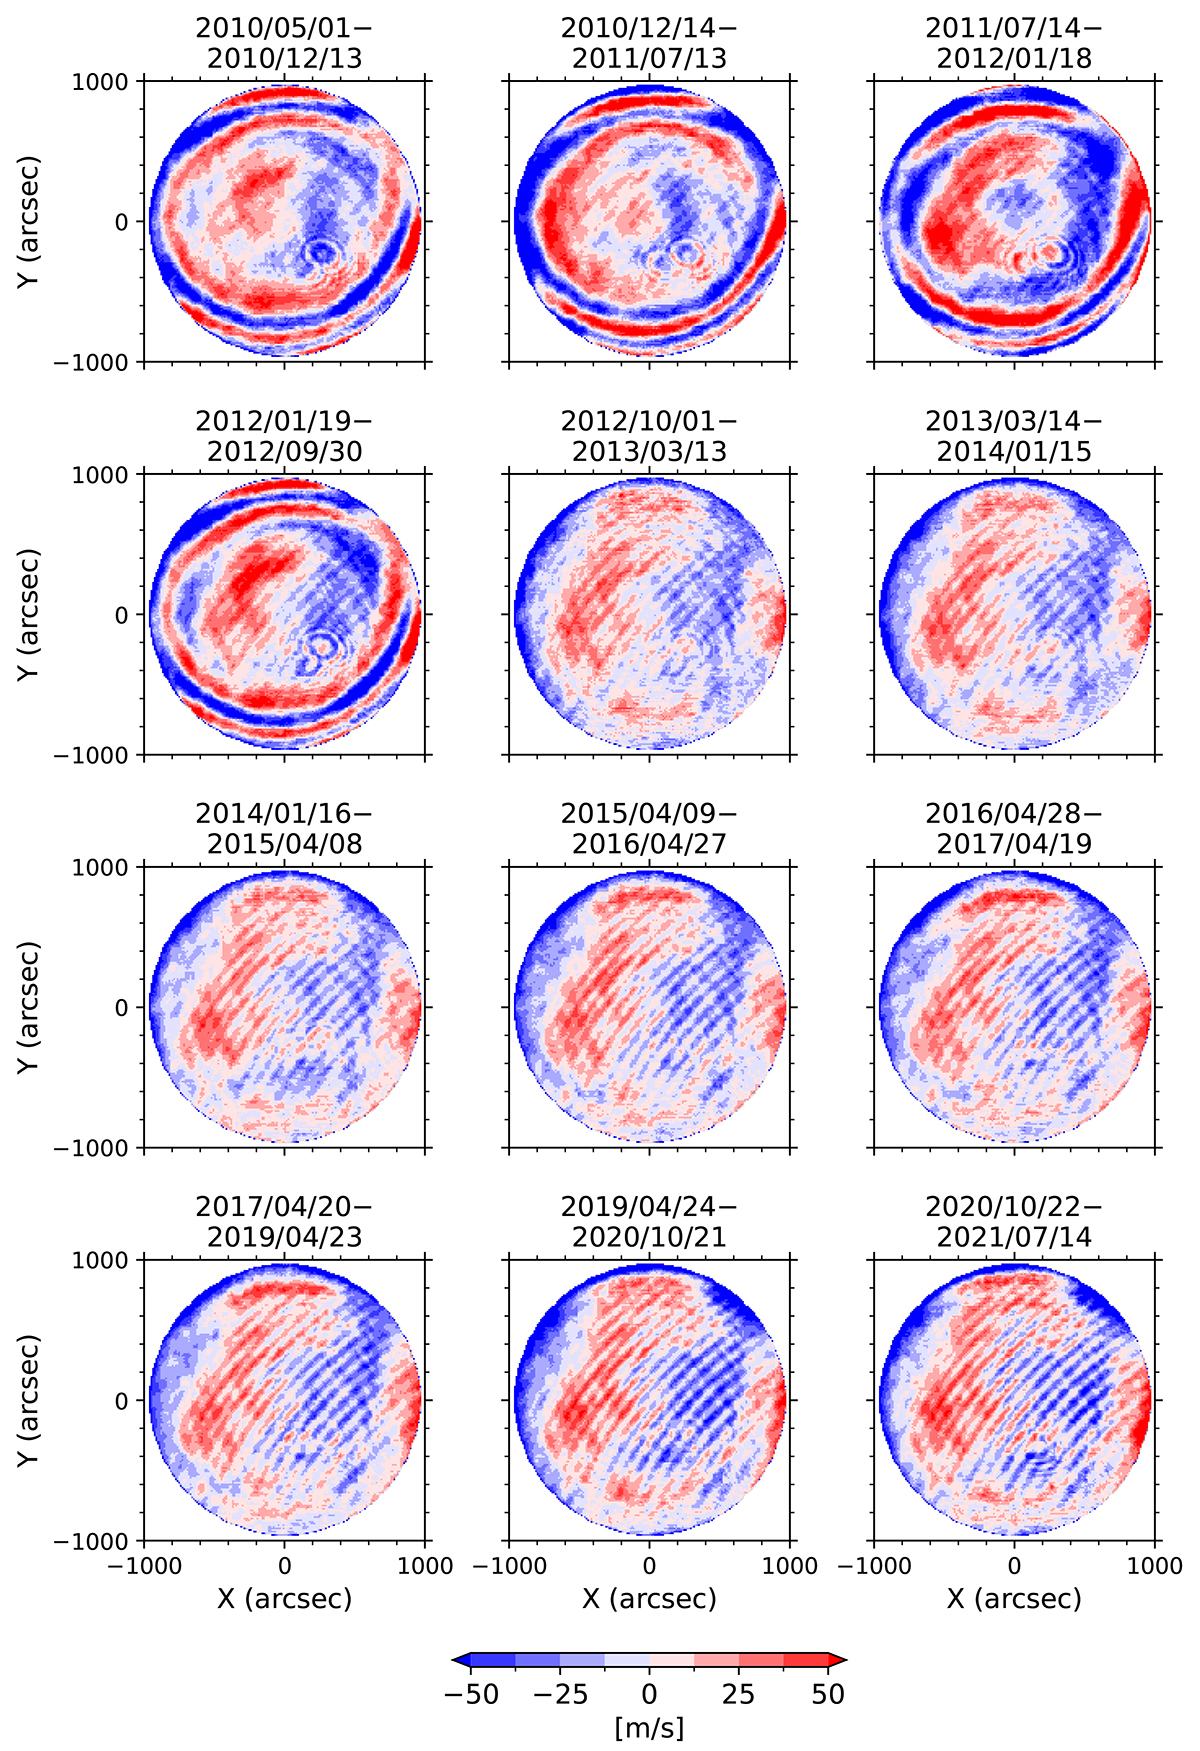
Fig. A.1.
Download original image
Median values of the Dopplergrams over the time periods between the HMI retuning dates listed at http://jsoc.stanford.edu/doc/data/hmi/hmi_retuning.txt. The images have been remapped to the same resolution (10″per pixel), with the disk center aligned north-up, and the Vbackground component subtracted. The color scale is saturated at ±50 m/s. Hathaway et al. (2015, their figure 2) shows a similar pattern in the HMI data from 2012 to 2013. The interference fringes appear as wavy patterns in the HMI images, caused by imperfections in the tunable-filter elements of the optical system. These unwanted patterns in the Dopplergrams exceed 50 m/s in magnitude, which is significantly higher than the amplitude of the HL1 mode. The large-scale fringes were substantially removed by the HMI team from 1 October 2012 (Couvidat et al. 2016), which explains why the fringes in the last eight panels are much weaker than in the first four panels. While the temporal frequency of these patterns is very low and far from the HL1 mode frequency, the patterns shift during HMI instrument re-tuning, causing jumps in the Doppler time series and increasing the background power in the Fourier domain. Removing these fringes enhances the visibility of the HL1 mode in the synoptic maps of Vzonal and improves the signal-to-noise ratio of the mode amplitude measurement.
Current usage metrics show cumulative count of Article Views (full-text article views including HTML views, PDF and ePub downloads, according to the available data) and Abstracts Views on Vision4Press platform.
Data correspond to usage on the plateform after 2015. The current usage metrics is available 48-96 hours after online publication and is updated daily on week days.
Initial download of the metrics may take a while.