Fig. 8.
Download original image
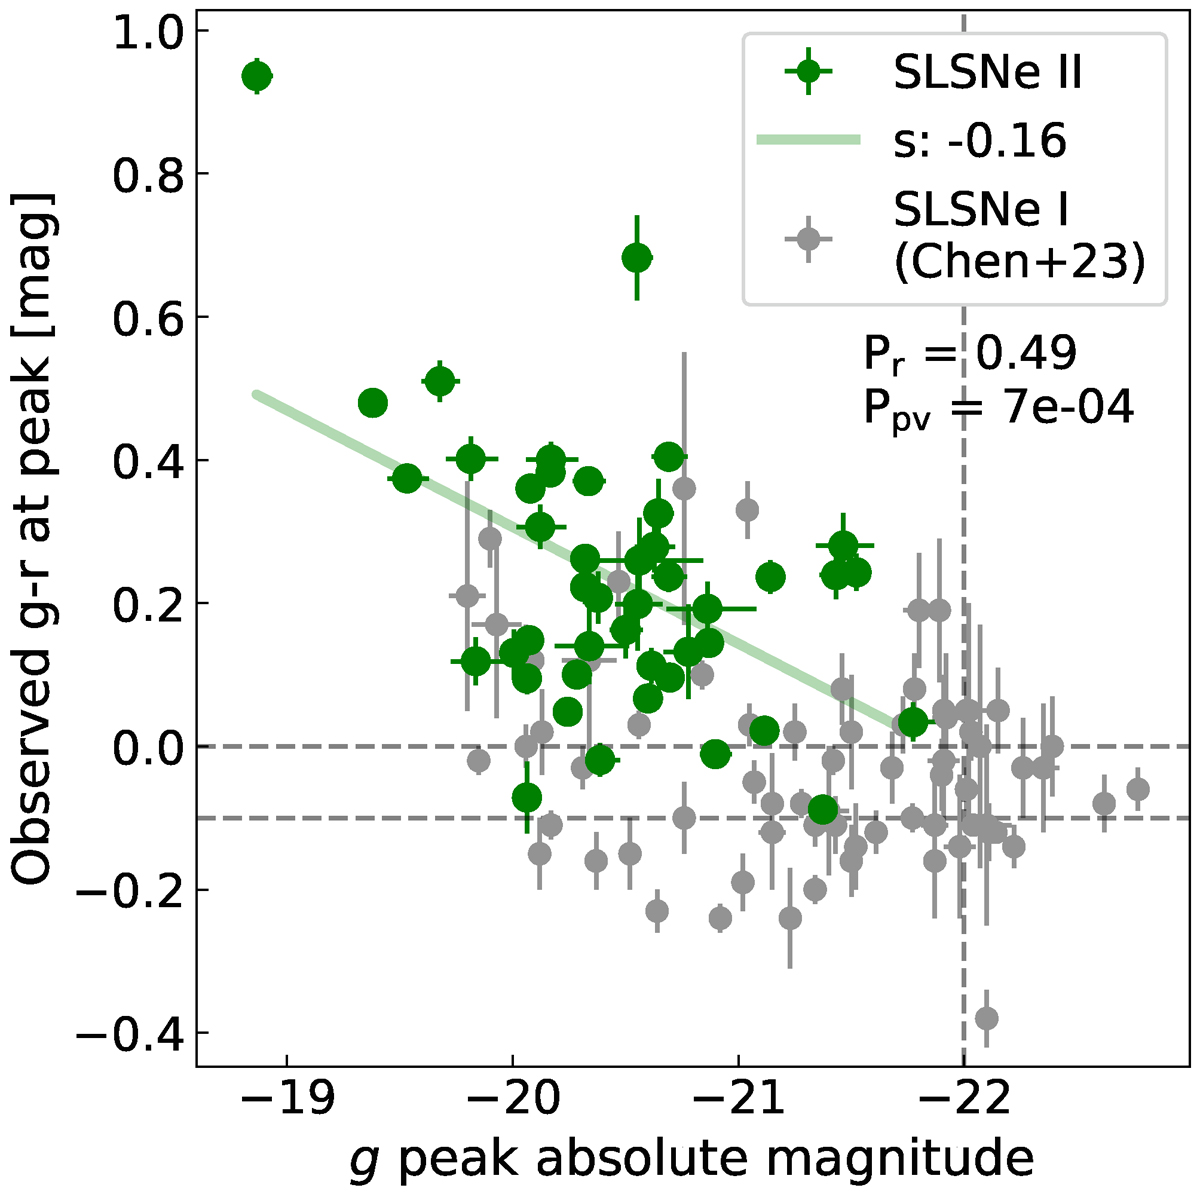
Observed g − r colors at around g band peak versus rest frame g band peak absolute magnitude of our SLSN II (green) and the sample of SLSN I (gray) presented by Chen et al. (2023). In green we include a straight line fit to the scatter plot, the slope (s) is indicated in the label of the figure. We also annotate the distribution’s Pearson’s r parameter and associated p value. Horizontal dashed gray lines show the interval between the bluest color of the SLSN II and color = 0.0 mag. A vertical dashed gray line indicates peak absolute magnitude = −22 mag.
Current usage metrics show cumulative count of Article Views (full-text article views including HTML views, PDF and ePub downloads, according to the available data) and Abstracts Views on Vision4Press platform.
Data correspond to usage on the plateform after 2015. The current usage metrics is available 48-96 hours after online publication and is updated daily on week days.
Initial download of the metrics may take a while.