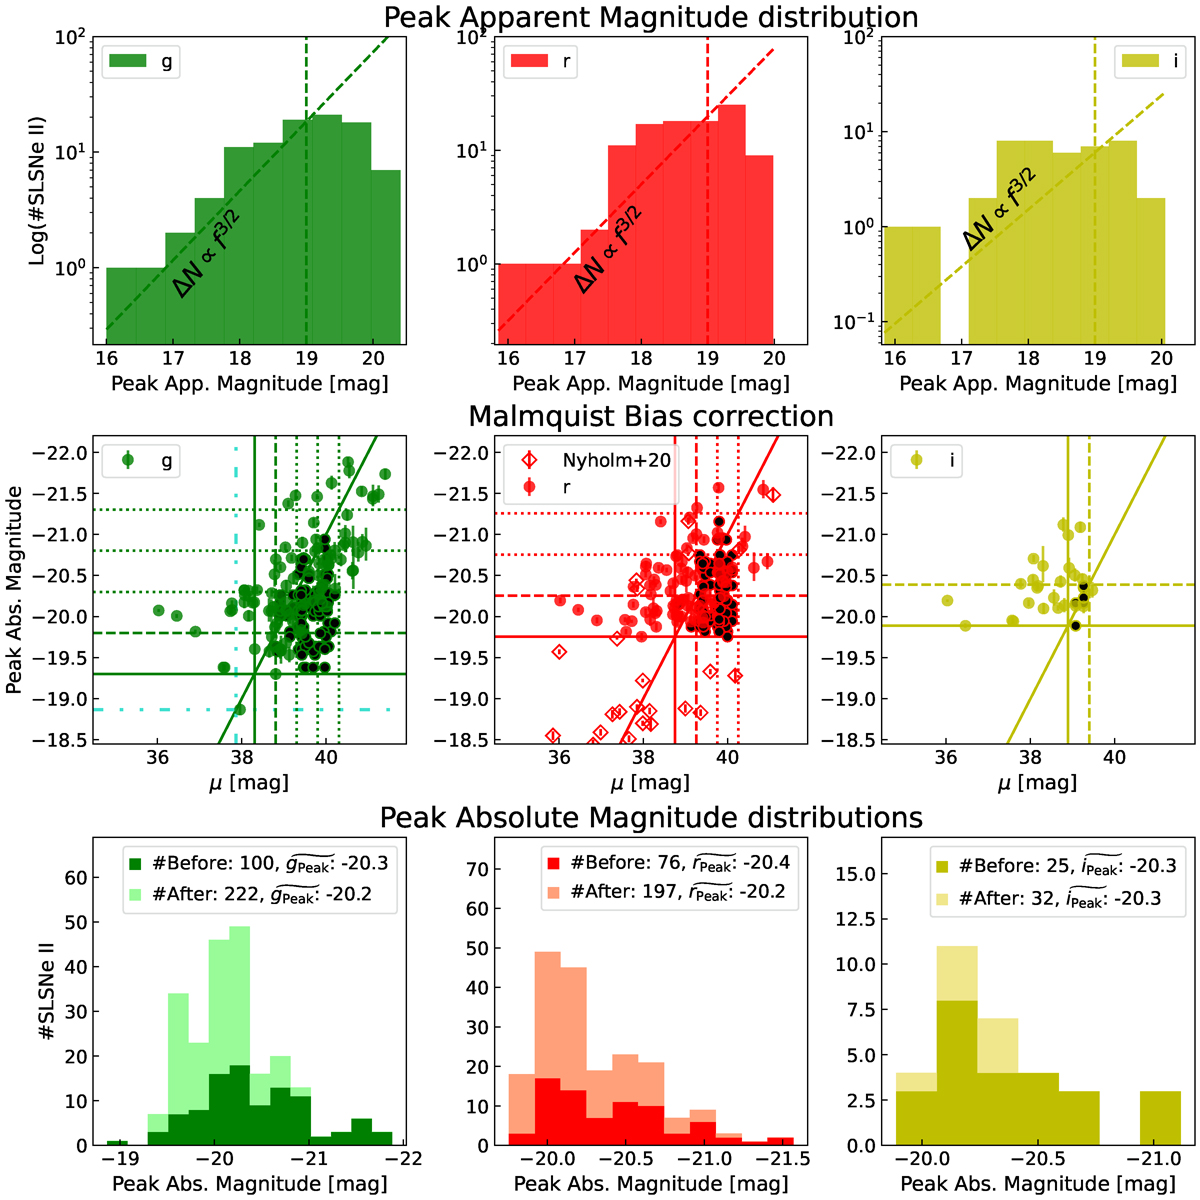
Fig. 12.
Download original image
Malmquist bias correction. The top row shows the peak apparent magnitude distribution of the observed sample in gri bands (left, middle, and right panels, respectively), the inclined dashed line shows the ΔN ∝ f3/2 relation, the vertical dashed line shows the integer magnitude closest to the last position at which the slope of this relation intersects the distribution. The second row shows the original rest frame peak absolute magnitude distribution with respect to the distance moduli in gri bands (left, middle, and right panels, respectively), together with the estimated distribution of missed events, presented as black dots. The solid horizontal lines indicate the faintest event of the distribution while the solid vertical lines indicate the corresponding distance modulus. The subsequent horizontal and vertical lines indicate 0.5 mag bins from the solid lines, respectively. The double dash-dotted turquoise lines in the first panel shows an event fainter than the one we consider for the analysis, we consider this event suffers from extinction and it is not considered. The third row shows the distribution of rest frame peak absolute magnitude in gri bands (left, middle, and right panels, respectively) before (dark colors) and after (light colors) applying the Malmquist bias correction.
Current usage metrics show cumulative count of Article Views (full-text article views including HTML views, PDF and ePub downloads, according to the available data) and Abstracts Views on Vision4Press platform.
Data correspond to usage on the plateform after 2015. The current usage metrics is available 48-96 hours after online publication and is updated daily on week days.
Initial download of the metrics may take a while.