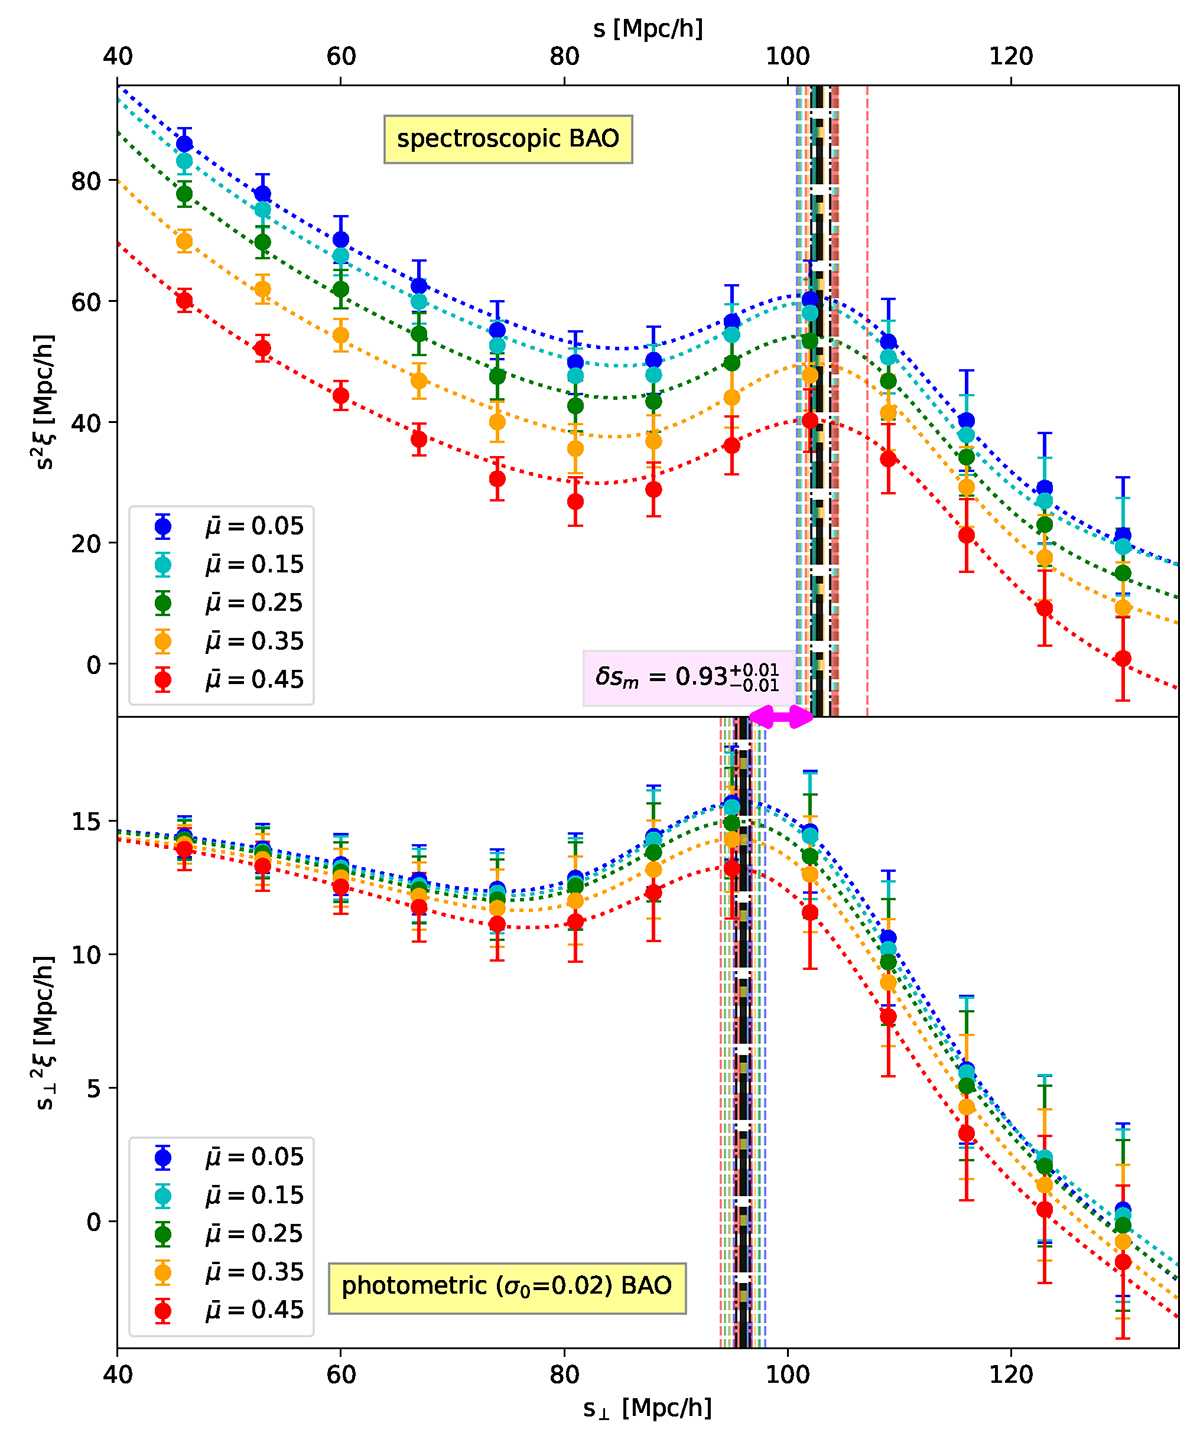
Fig. 7.
Download original image
Comparison of the BAO peak locations in spectroscopic (upper panel) and photometric (lower panel) redshift data. The vertical lines in various colors correspond to the location of the BAO peak found by fitting a six-parameter model to various μ bins. The vertical black line is the average and its error bar for all μ bins combined. There is a systematic shift that has to be accounted for by either a correction factor or dedicated templates for photometric redshifts.
Current usage metrics show cumulative count of Article Views (full-text article views including HTML views, PDF and ePub downloads, according to the available data) and Abstracts Views on Vision4Press platform.
Data correspond to usage on the plateform after 2015. The current usage metrics is available 48-96 hours after online publication and is updated daily on week days.
Initial download of the metrics may take a while.