Fig. 4
Download original image
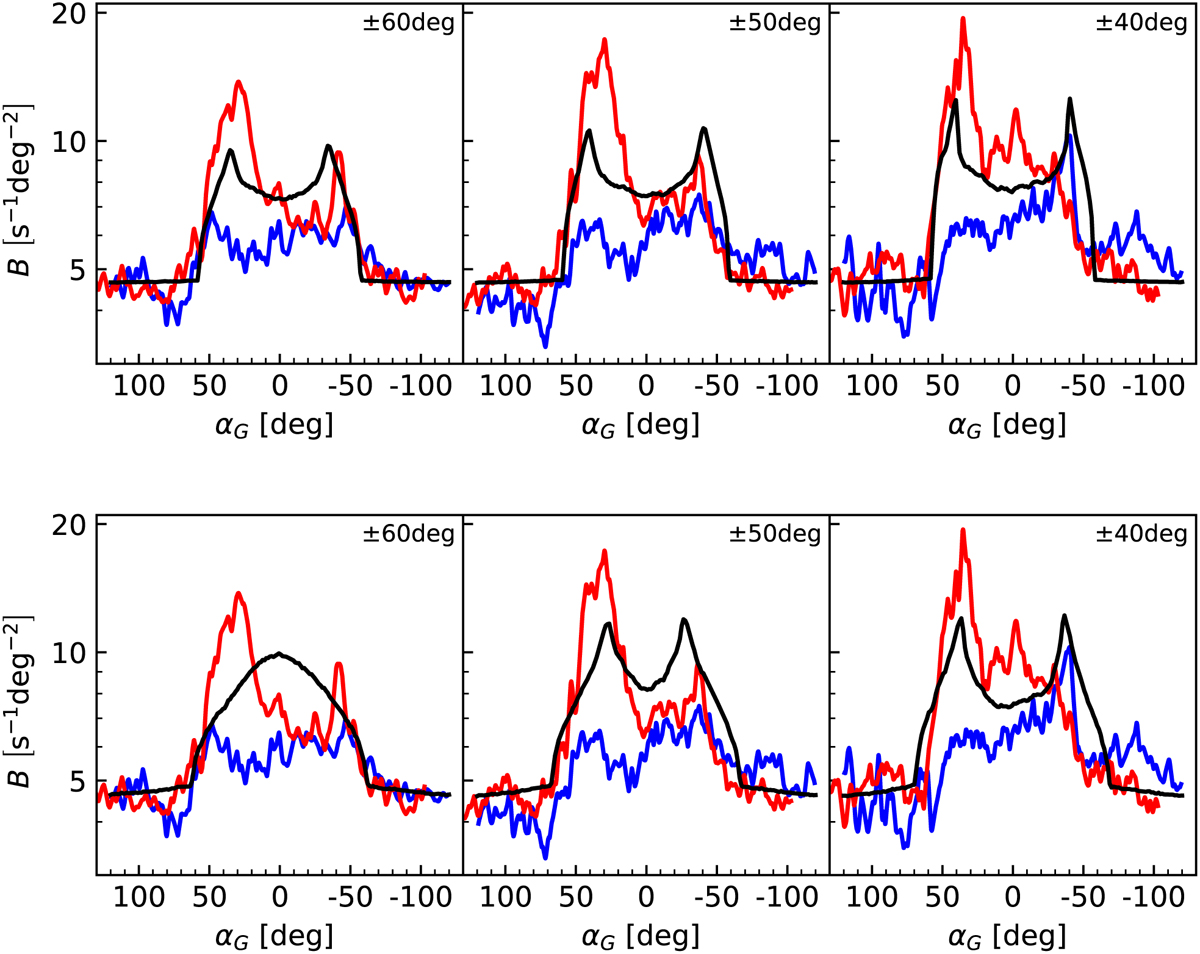
Brightness profiles of our synthetic observations at different latitudes. The top panel shows the surface brightness B for the β-model halo bubble and the bottom panel for the multicomponent model bubble for the latitudes ±40°, ±50°, and ±60° along the longitudes αG. Only the northern brightness profiles of our synthetic observations (black) are shown and compared to the data of the northern (red) and southern (blue) EB from Predehl et al. (2020). The northern eROSITA data was shifted by 16.5° to the east. Furthermore, a constant background X-ray radiation was added to our data similarly to Fig. 3 to better compare it to the observations.
Current usage metrics show cumulative count of Article Views (full-text article views including HTML views, PDF and ePub downloads, according to the available data) and Abstracts Views on Vision4Press platform.
Data correspond to usage on the plateform after 2015. The current usage metrics is available 48-96 hours after online publication and is updated daily on week days.
Initial download of the metrics may take a while.