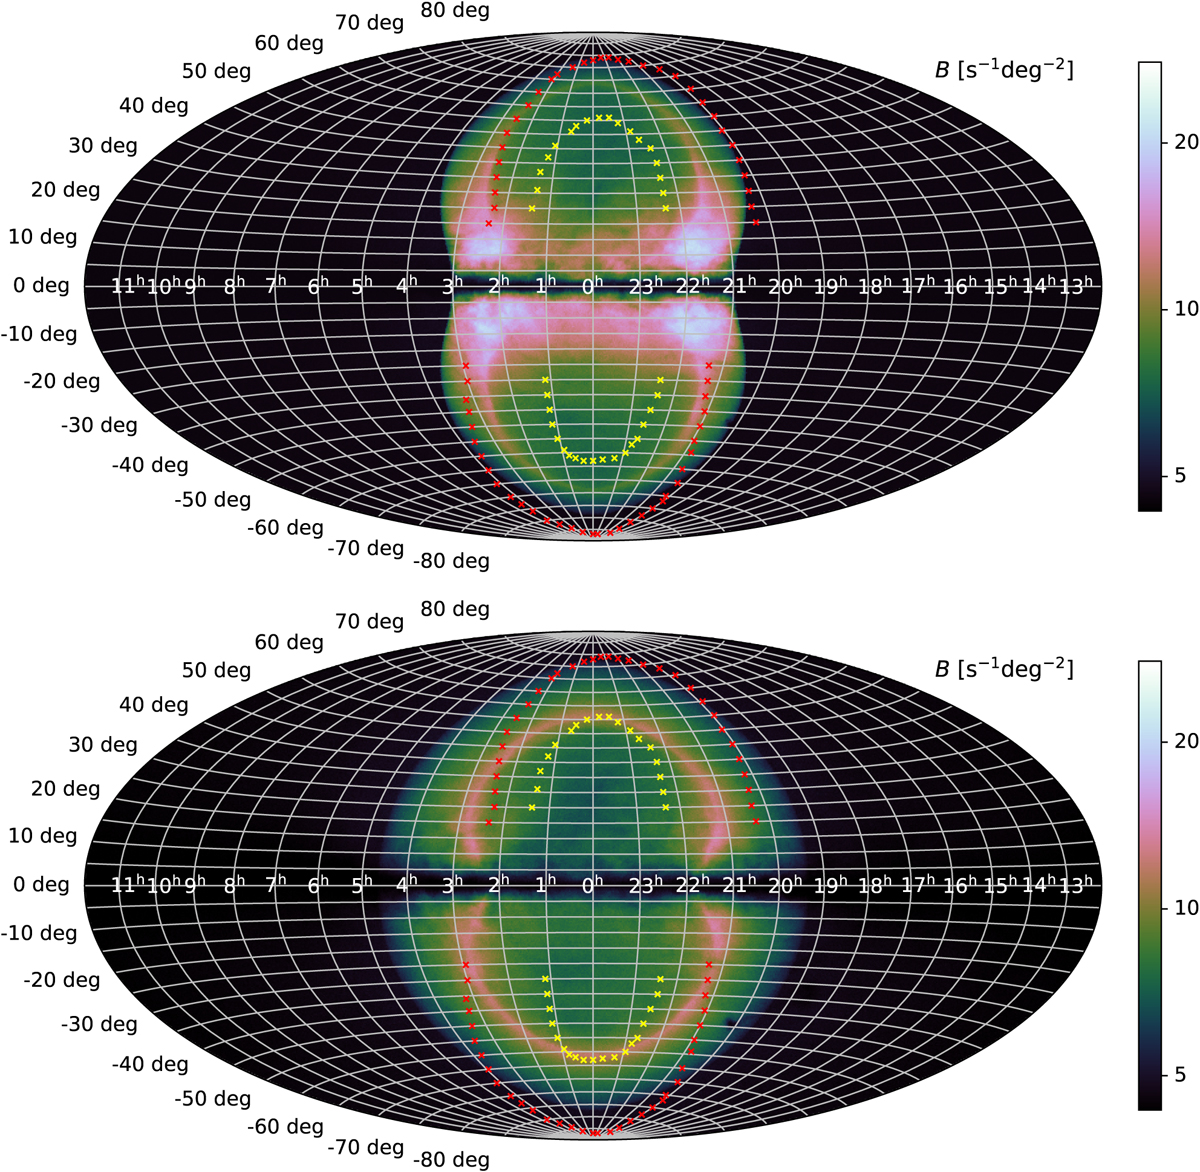
Fig. 3
Download original image
Synthetic observations of the full three-dimensional simulation results using a Hammer–Aitoff projection in Galactic coordinates. The color-coded intensity is the surface brightness B in logarithmic units for the photons detected per time and solid angle and corresponds to detected X-ray photons with an energy between 0.6 keV and 1 keV. Since the cosmic X-ray background was not included in our model, we added it as a constant value to the maps so that we arrive at the same minimum brightness of 4.66 photons s−1 deg−2 as Predehl et al. (2020). The colorbar limits (obtained from Tseng et al. 2024) are the same as in the observations of Predehl et al. (2020). The main underlying model is the thermal collisional ionization equilibrium model of Cloudy. Both, the geometry for an observation from the Solar System and instrumental effects of the eROSITA telescope were considered for these figures. The FBs would appear at the contact discontinuity, which lies at the inner side of the brighter region (pink-white color) according to our model. The approximate shell of the observed EBs (red) and FBs (yellow) are indicated using data points obtained from Predehl et al. (2020, Fig. 3). We note that these points have a reading error of about ±5° and ±1 h because the edges of the observed EBs and FBs are not clearly defined everywhere. The top panel shows the β-model halo bubble (cf. Fig. 2 bottom left) and the bottom panel shows the multicomponent model halo bubble (cf. Fig. 2 bottom right).
Current usage metrics show cumulative count of Article Views (full-text article views including HTML views, PDF and ePub downloads, according to the available data) and Abstracts Views on Vision4Press platform.
Data correspond to usage on the plateform after 2015. The current usage metrics is available 48-96 hours after online publication and is updated daily on week days.
Initial download of the metrics may take a while.