Fig. 2
Download original image
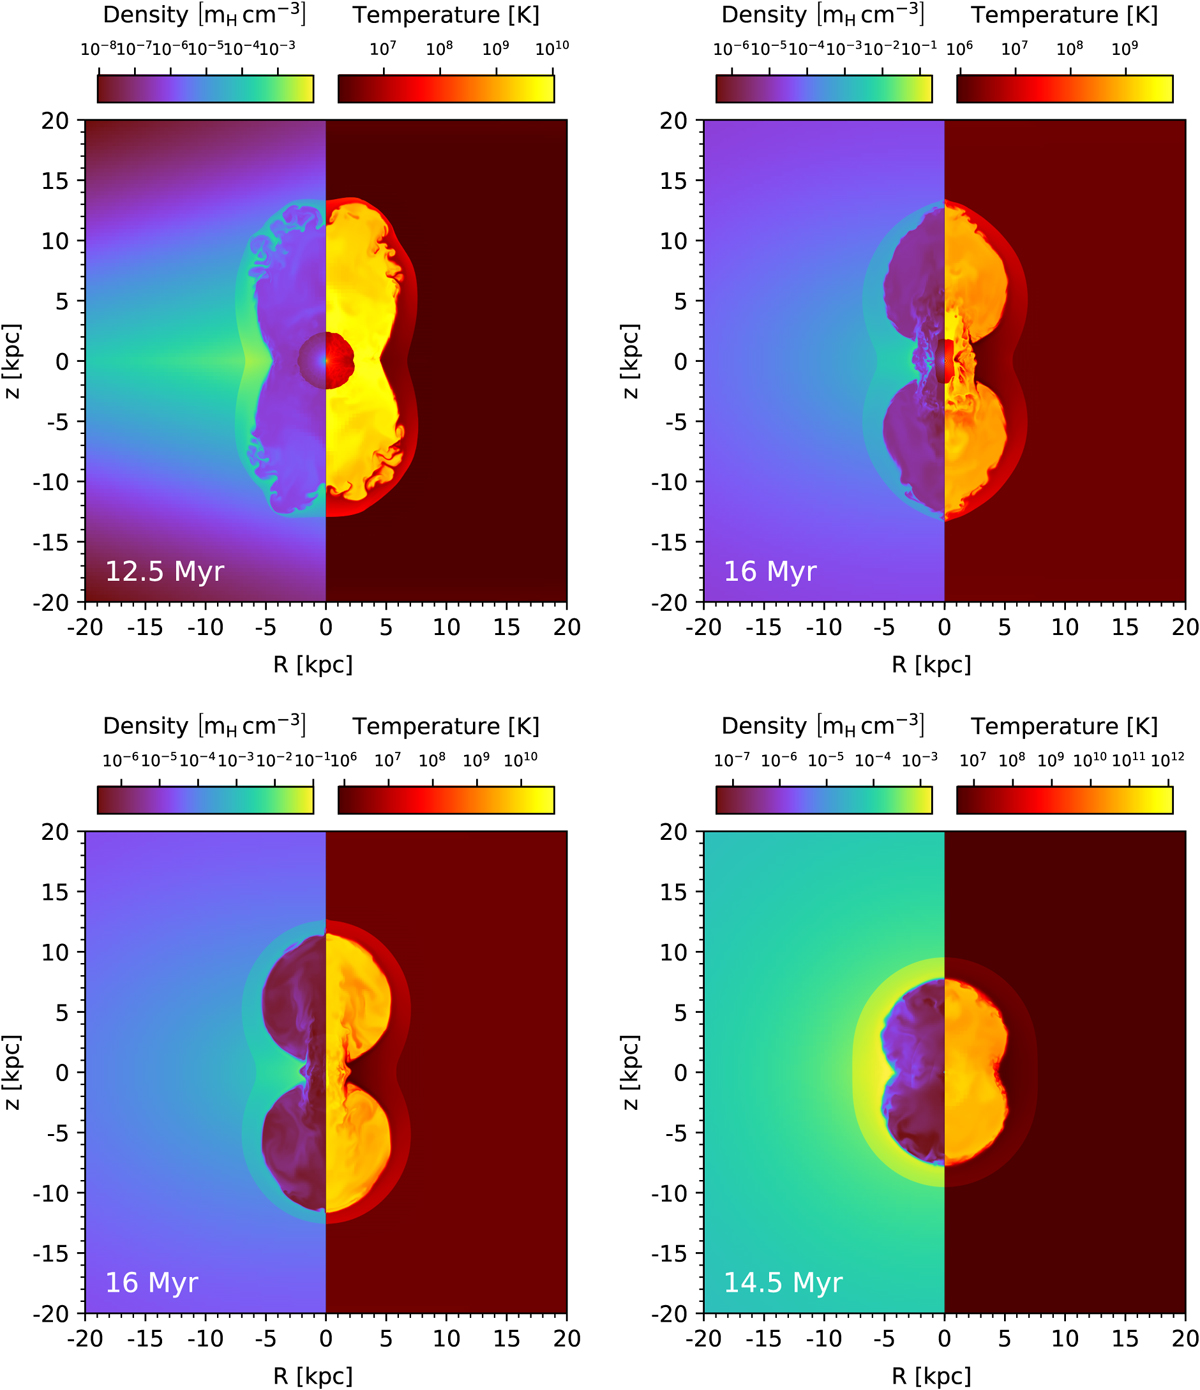
Resulting density distributions of the numerical simulations for different Milky Way models and TDE rates. The snapshots are taken at the end of the simulations when the forward shocks reach the size of the EBs and show the detailed bubble structure, including the elapsed time since the first TDE. The different subfigures correspond to the results of the exponential halo model with energy and mass injections every 100–1000 yr (top left), the β-model halo with TDEs every 10 kyr (top right), the β-model halo with TDEs every 100 kyr (bottom left), and the multicomponent model with TDEs every 100 kyr (bottom right).
Current usage metrics show cumulative count of Article Views (full-text article views including HTML views, PDF and ePub downloads, according to the available data) and Abstracts Views on Vision4Press platform.
Data correspond to usage on the plateform after 2015. The current usage metrics is available 48-96 hours after online publication and is updated daily on week days.
Initial download of the metrics may take a while.