Fig. 5.
Download original image
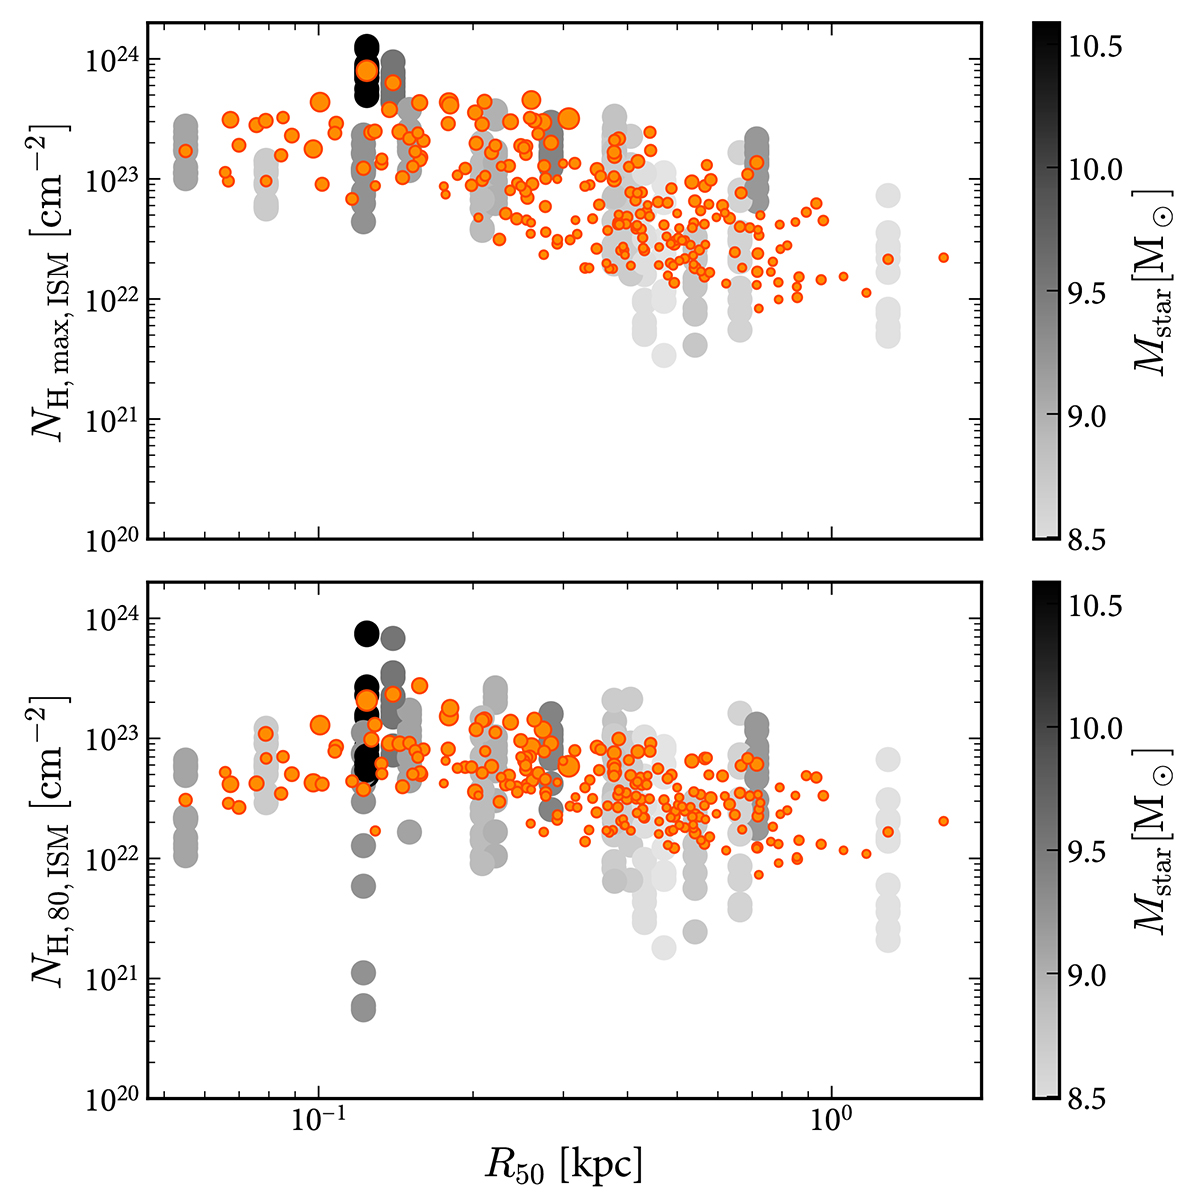
Relation between hydrogen column density in the ISM and galaxy mass and half-mass radius at z = 6. Top panel: column density obtained integrating the column density from the position of the MBH to the host galaxy virial radius (“max” model). Bottom panel: column density obtained excluding the inner 80 pc around the MBH (“outmax80” model). The orange points show the mean column density for each galaxy, with size scaling with Mstar. For a random subset of 24 galaxies we show the column density for 12 different lines of sight, with the grayscale proportional to Mstar, as shown in the color bar.
Current usage metrics show cumulative count of Article Views (full-text article views including HTML views, PDF and ePub downloads, according to the available data) and Abstracts Views on Vision4Press platform.
Data correspond to usage on the plateform after 2015. The current usage metrics is available 48-96 hours after online publication and is updated daily on week days.
Initial download of the metrics may take a while.