Fig. 2.
Download original image
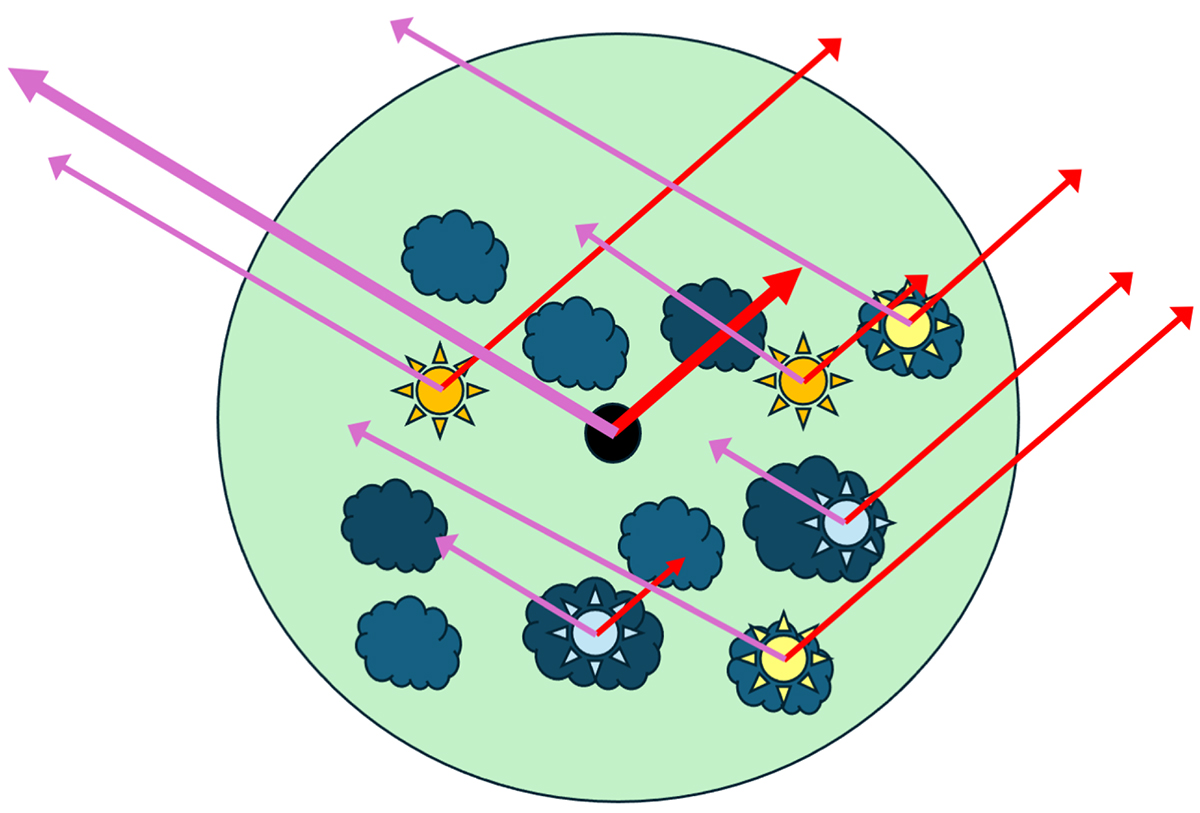
Sketch of our approach to modeling gas and dust absorption, showing how differential attenuation affects different parts of a given galaxy and lines of sight. We highlight two lines of sight with rays shown in purple and red arrows for each emitter. Darker gray colors show gas and dust clouds with larger optical depth. Stars’ colors indicate age: for instance young (blue) stars are generally still embedded in their birth clouds, while this is not necessarily the case for older (yellow and orange) stars. Since at least some star-forming regions are dusty, their contribution to the SED will be more affected by the extinction curve than other parts of the galaxy. The position of the AGN is marked in black, with thicker arrows. The example distribution of emitters and absorbers shown here has been chosen to highlight how the same source can be AGN- or stellar-dominated, depending on the line of sight. In this example, along the cumulative purple line of sight the AGN dominates over starlight: the AGN is seen through a clear line of sight, while much of the emission from the stellar population is absorbed. Vice-versa, along the cumulative red line of sight the AGN emission is sub-dominant to starlight.
Current usage metrics show cumulative count of Article Views (full-text article views including HTML views, PDF and ePub downloads, according to the available data) and Abstracts Views on Vision4Press platform.
Data correspond to usage on the plateform after 2015. The current usage metrics is available 48-96 hours after online publication and is updated daily on week days.
Initial download of the metrics may take a while.