Fig. 10.
Download original image
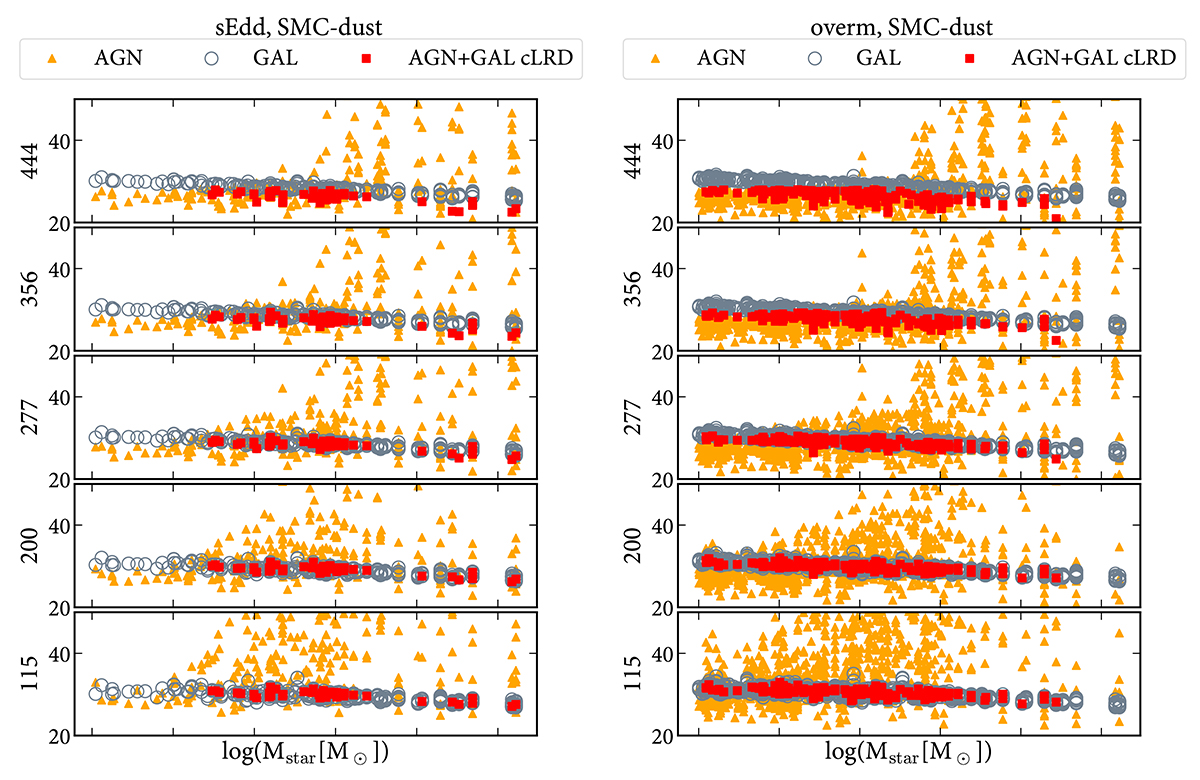
Magnitudes for the “sEdd” and “overm” models and SMC-like dust. The orange triangles and gray circles show separately the flux of AGN and galaxies, when selecting systems with Lbol > 1044 erg s−1 and m444W < 28 (total flux, summing both AGN and galaxy contribution). The red dots have both of the above, plus the UNCOVER color selection, and show the combined galaxy+AGN flux. We have limited the y axis to 50 to highlight the relevant parameter space. At 115 and 200 the galaxy is almost always brighter than the AGN, whose contribution increases as the wavelength increases. For the “overm” case some AGN are brighter than the galaxy also at short wavelenghts.
Current usage metrics show cumulative count of Article Views (full-text article views including HTML views, PDF and ePub downloads, according to the available data) and Abstracts Views on Vision4Press platform.
Data correspond to usage on the plateform after 2015. The current usage metrics is available 48-96 hours after online publication and is updated daily on week days.
Initial download of the metrics may take a while.