Fig. 9.
Download original image
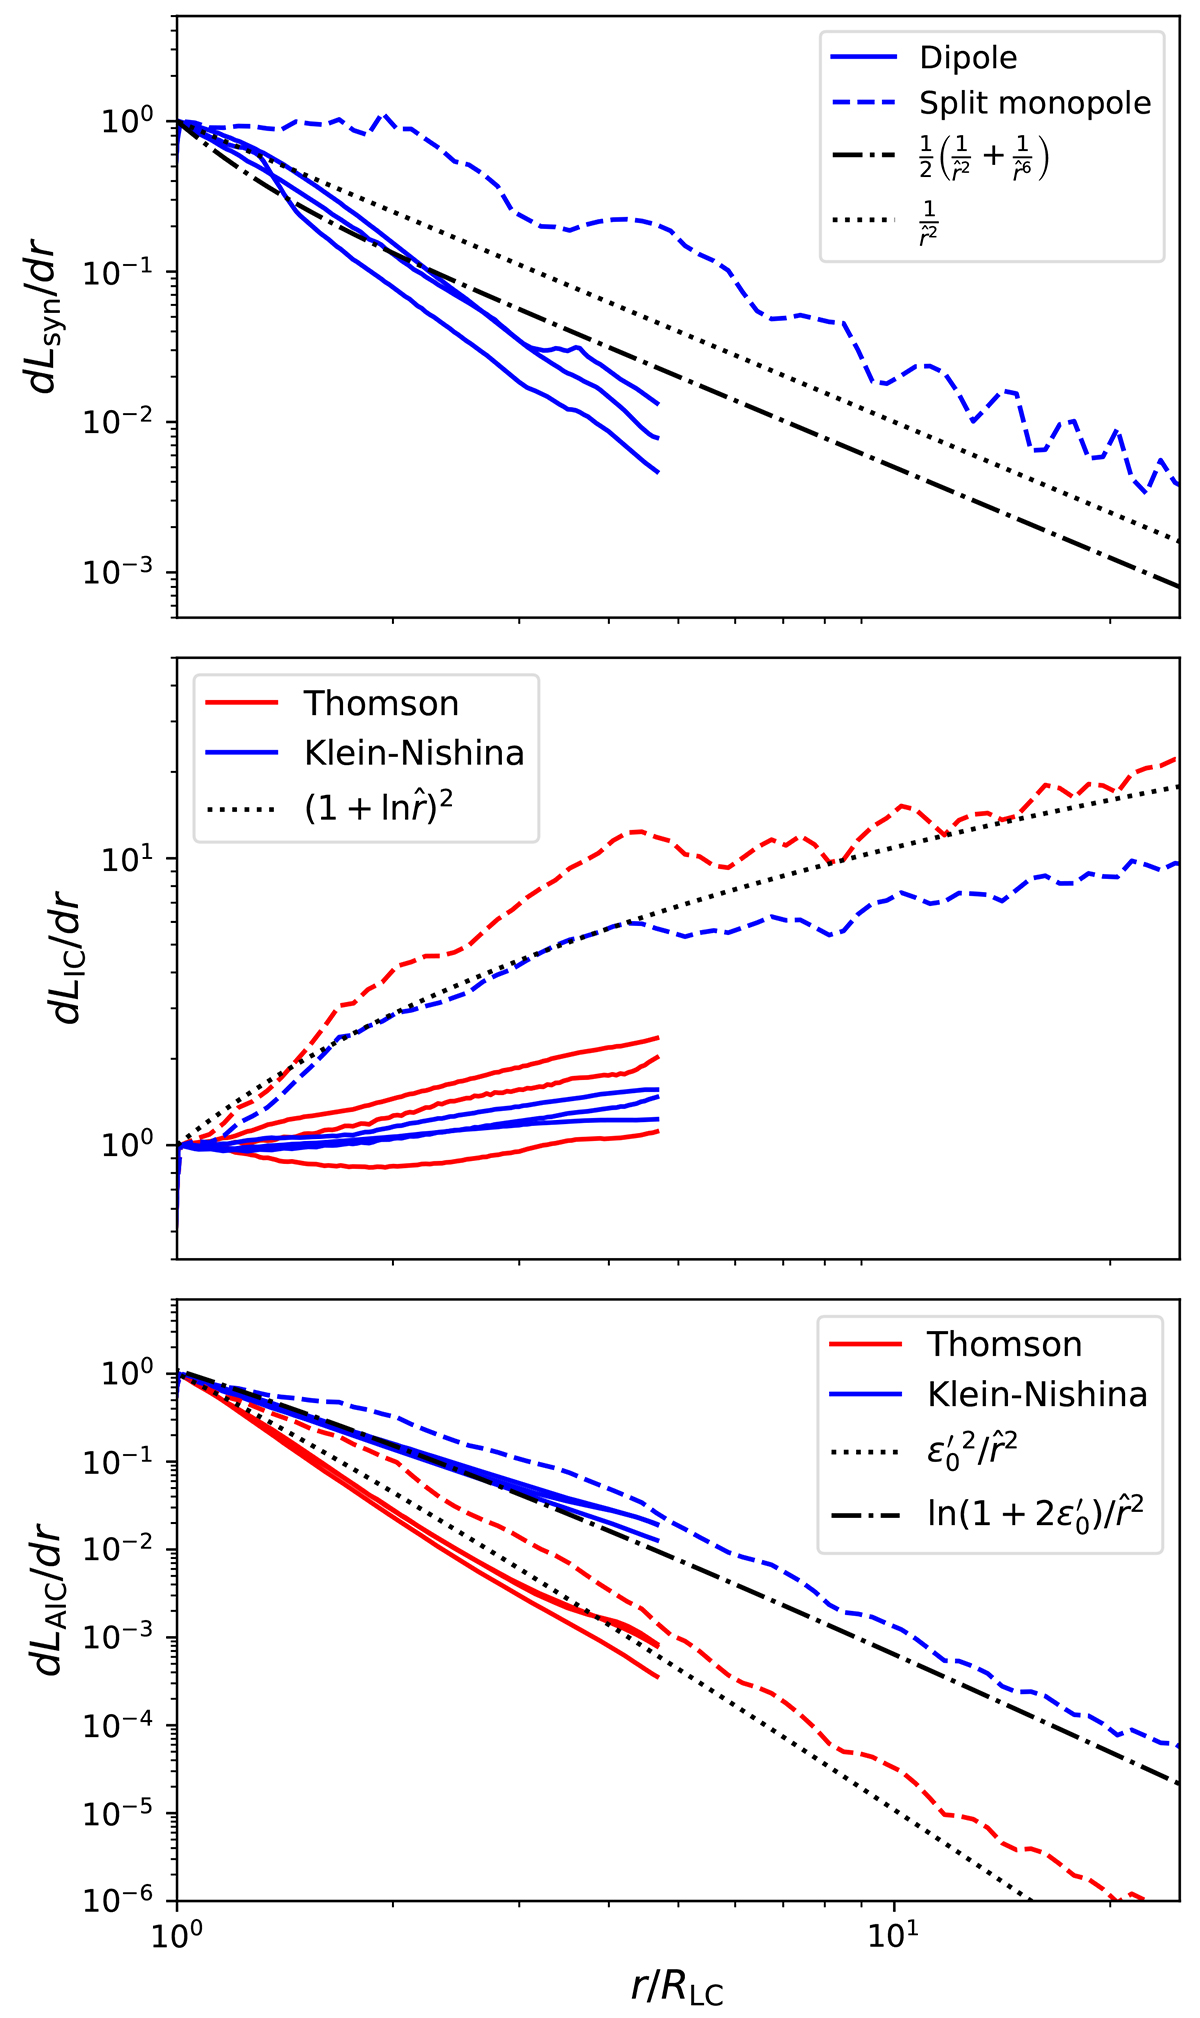
Radial distribution of the frequency-integrated radiated power in the synchrotron channel (top panel), in the inverse Compton channel for both an isotropic (middle panel) and an anisotropic (from the star, bottom panel) target photon field in the Thomson (red lines) and deep Klein-Nishina (blue lines) regimes. Simulations with an initial dipolar field are shown by solid lines (χ = 30°, 45°, 60°), while the split-monopole simulation is shown by dashed lines. Simple analytical expressions are also overplotted for comparison (black dashed-dotted and dotted lines). All quantities are normalized by their value at the light cylinder.
Current usage metrics show cumulative count of Article Views (full-text article views including HTML views, PDF and ePub downloads, according to the available data) and Abstracts Views on Vision4Press platform.
Data correspond to usage on the plateform after 2015. The current usage metrics is available 48-96 hours after online publication and is updated daily on week days.
Initial download of the metrics may take a while.