Fig. 8.
Download original image
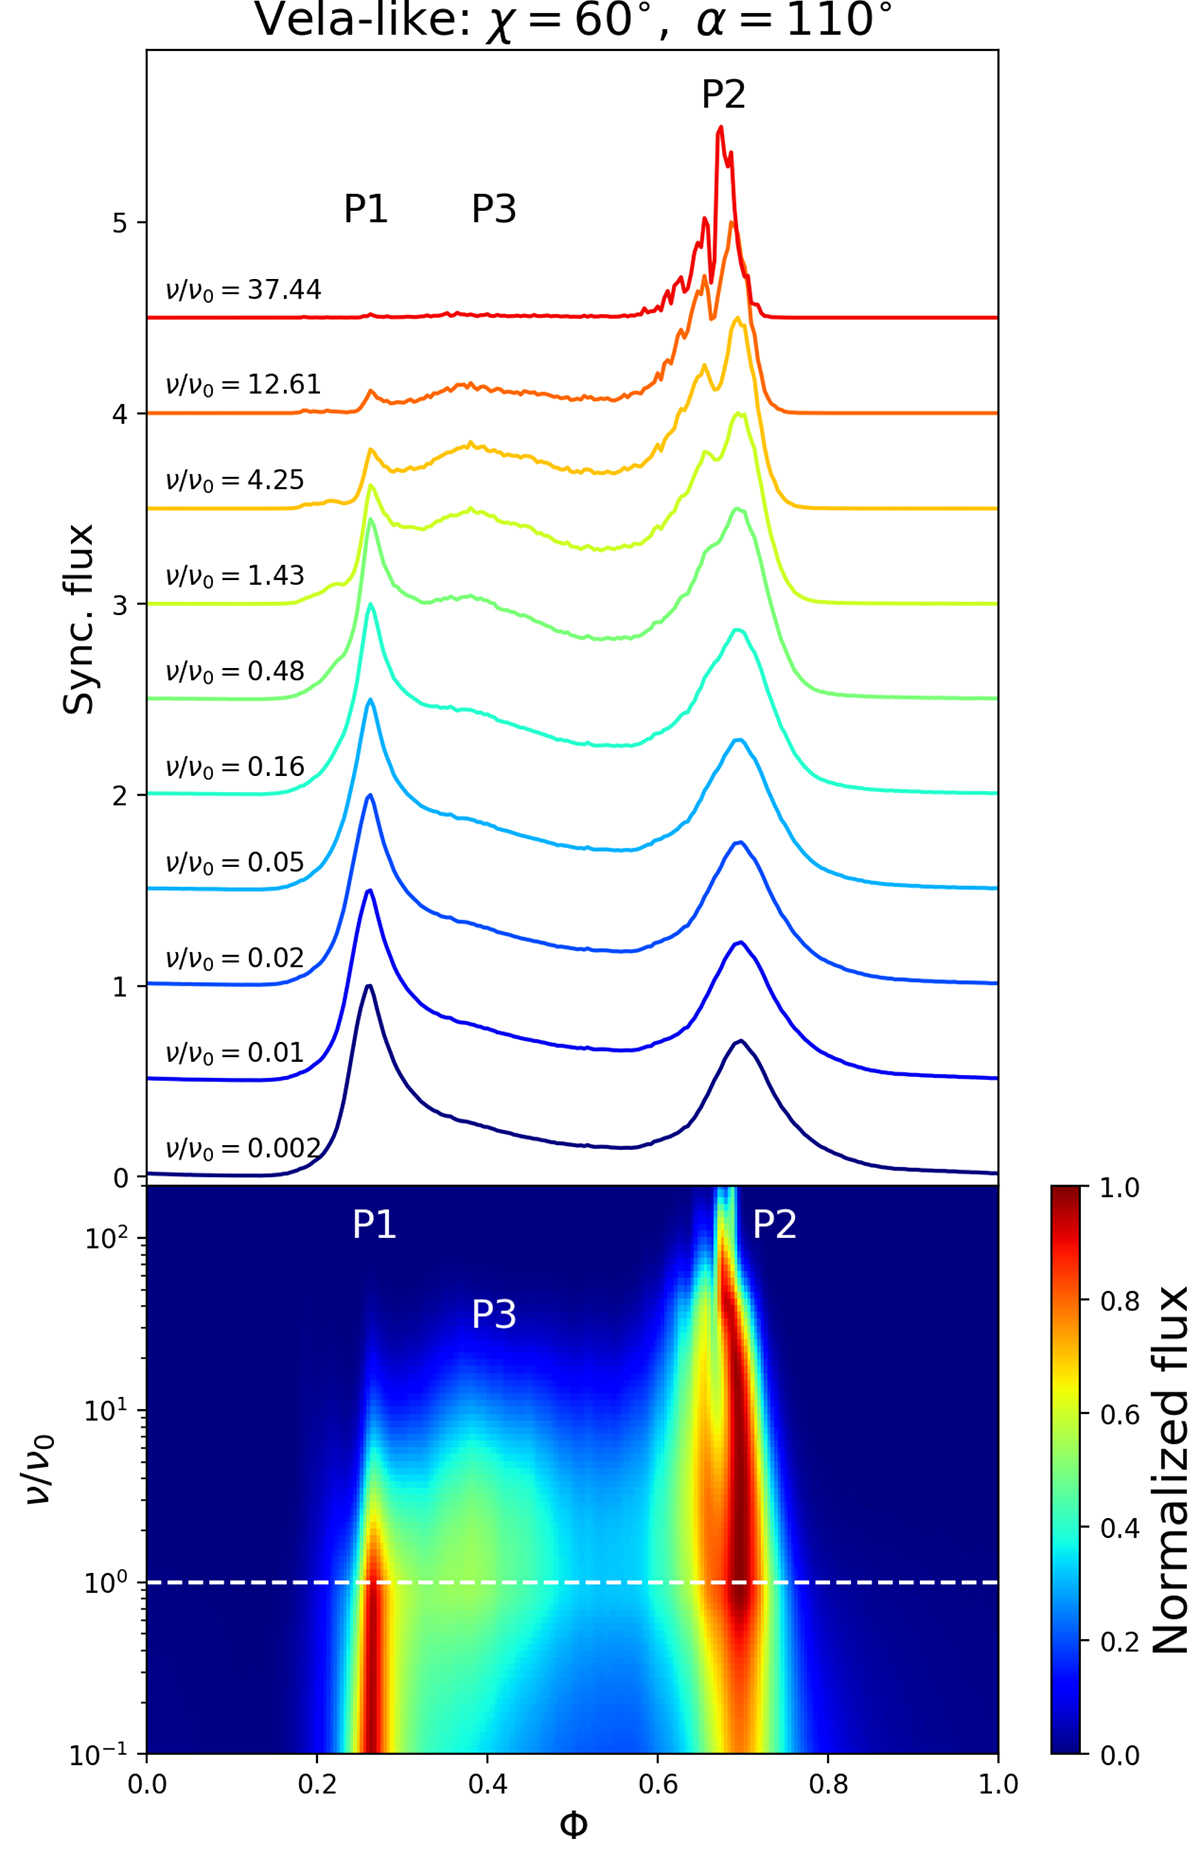
Energy dependence of the synthetic synchrotron pulse profile with the photon frequency, ν normalized to ν0, for a Vela-like solution (χ = 60°, α = 110°). Top panel: Light curves equally spaced in log ν/ν0 from the lowest frequencies (bottom) to the highest frequencies (top). The bottom panel shows the full phase-frequency emission map. In both panels, light curves are normalized to the maximum flux for each frequency band. This figure only shows the contribution from positrons.
Current usage metrics show cumulative count of Article Views (full-text article views including HTML views, PDF and ePub downloads, according to the available data) and Abstracts Views on Vision4Press platform.
Data correspond to usage on the plateform after 2015. The current usage metrics is available 48-96 hours after online publication and is updated daily on week days.
Initial download of the metrics may take a while.