Fig. 7.
Download original image
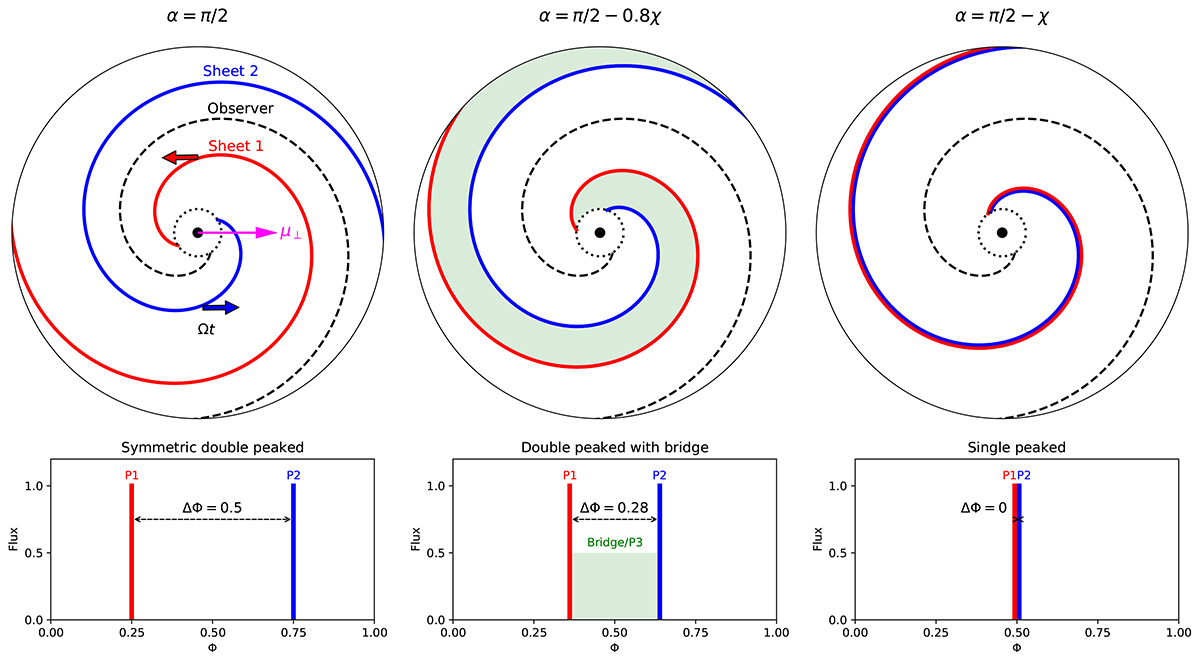
Schematic representation illustrating how pulses form relying on simple geometric considerations based on the split-monopole configuration. Here, χ = 60° for illustrative purposes, but this picture applies for all inclinations (except the aligned and orthogonal rotators). In this diagram, the pulse P1 (P2) is emitted once the sheet 1 (respectively 2) rotating at the angular velocity of the star, Ω, overlaps with the fixed black dashed line, an iso-phase contour set by the observer. Three typical configurations are presented: (i) an equatorial view (α = π/2) leads to two symmetric pulses separated by ΔΦ = 0.5, (ii) an off-equator view within the striped wind region (α = π/2 − 0.8χ) where the pulses are asymmetric and separated by ΔΦ = 0.28 and contains significant emission in between (a bridge or third peak, green region), and (iii) the degenerate single pulse case (ΔΦ = 0) where the observer’s line of sight grazes the outer boundary of the stripes (α = π/2 − χ).
Current usage metrics show cumulative count of Article Views (full-text article views including HTML views, PDF and ePub downloads, according to the available data) and Abstracts Views on Vision4Press platform.
Data correspond to usage on the plateform after 2015. The current usage metrics is available 48-96 hours after online publication and is updated daily on week days.
Initial download of the metrics may take a while.