Fig. 12.
Download original image
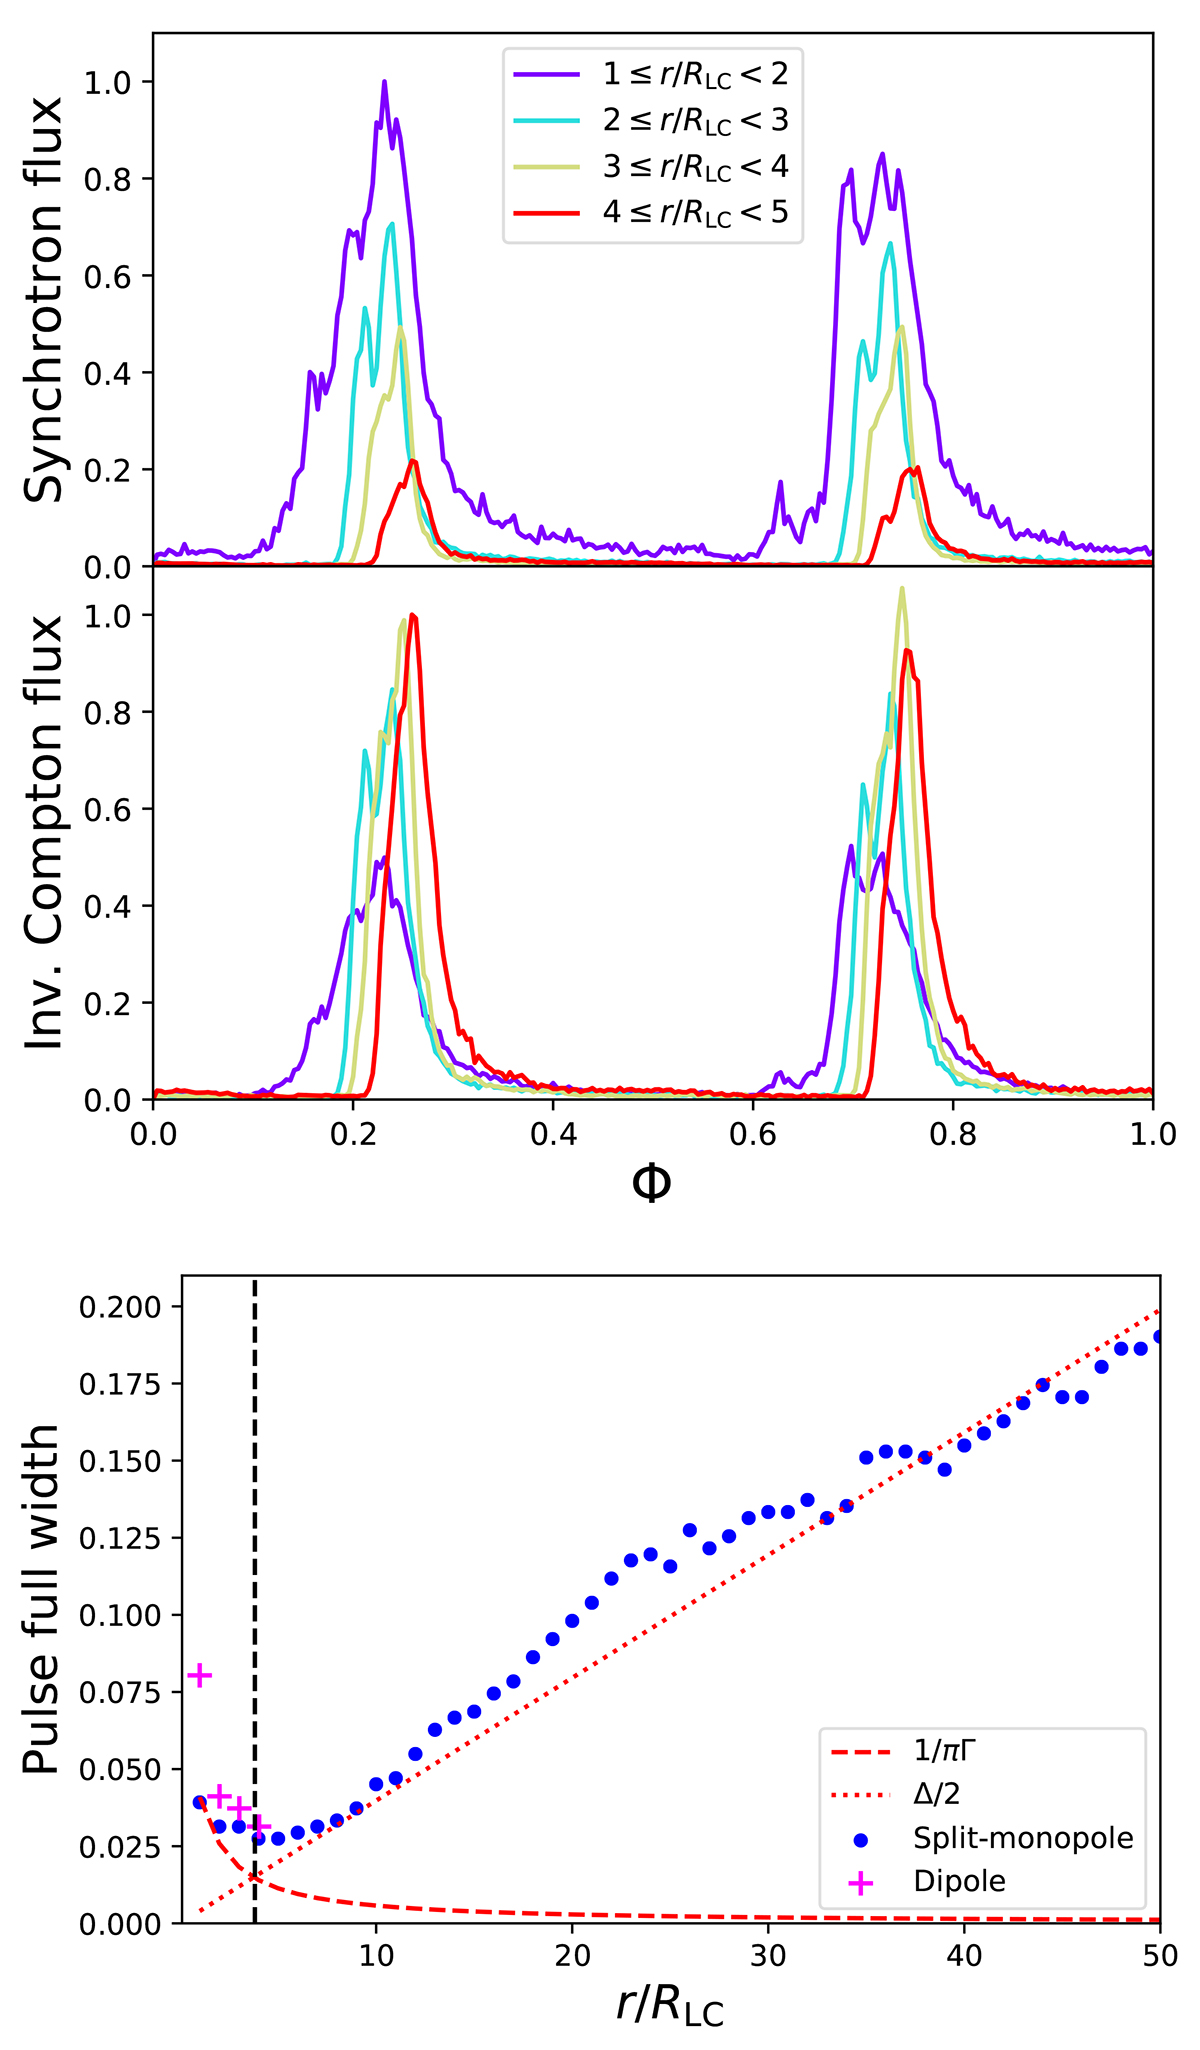
Evolution of the observed light curve as a function of the radius of emission. Top panel: Synthetic synchrotron and inverse Compton (isotropic radiation field) light curves as a function of the emitting radius, from the light-cylinder radius up to 5LC for the dipole simulation (χ = 60°, α = 90°). Bottom panel: Full width at half maximum of the inverse Compton pulse width as a function of radius for the dipole (magenta crosses) and split-monopole (blue dots) simulations. The red dotted and dashed lines shows the two asymptotic behaviors discussed here. The black vertical dashed line marks the location of the critical radius rm where the emitted pulses are the narrowest.
Current usage metrics show cumulative count of Article Views (full-text article views including HTML views, PDF and ePub downloads, according to the available data) and Abstracts Views on Vision4Press platform.
Data correspond to usage on the plateform after 2015. The current usage metrics is available 48-96 hours after online publication and is updated daily on week days.
Initial download of the metrics may take a while.