Fig. 5
Download original image
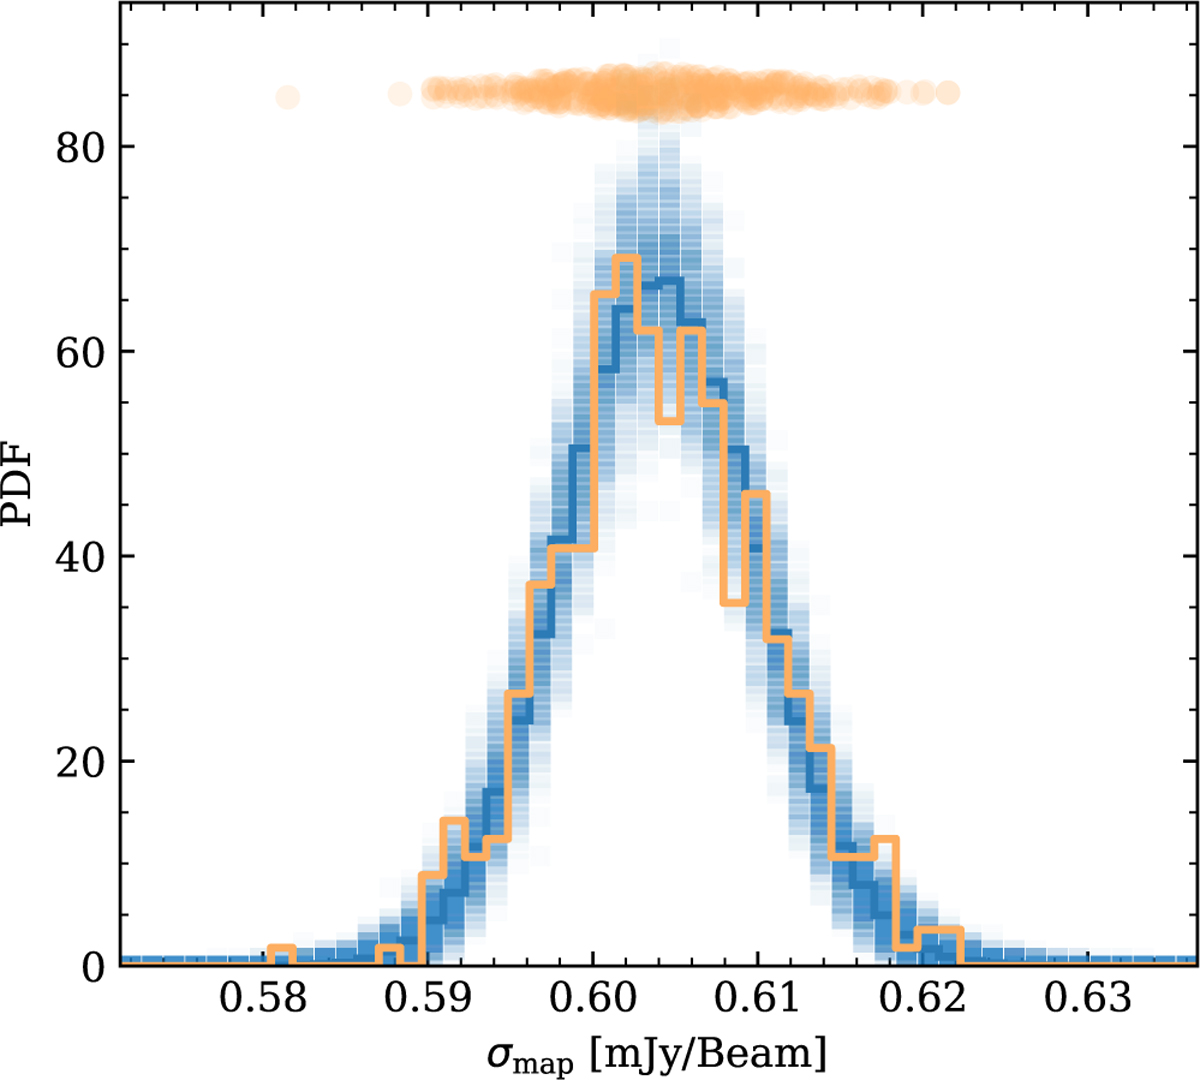
Comparison of the standard deviation σmap measured from different simobserve realizations using 200 different random seeds (orange points and corresponding histogram) and the σmap of the jackknifing for each corresponding mock observation (shaded blue squares). The thick blue line traces the total distribution of the derived standard deviations, σmap when averaging over all the jackknife realizations for all the different simobserve seeds. Through jackknifing, we thus recover the true noise distribution of the observations.
Current usage metrics show cumulative count of Article Views (full-text article views including HTML views, PDF and ePub downloads, according to the available data) and Abstracts Views on Vision4Press platform.
Data correspond to usage on the plateform after 2015. The current usage metrics is available 48-96 hours after online publication and is updated daily on week days.
Initial download of the metrics may take a while.