Fig. A.1
Download original image
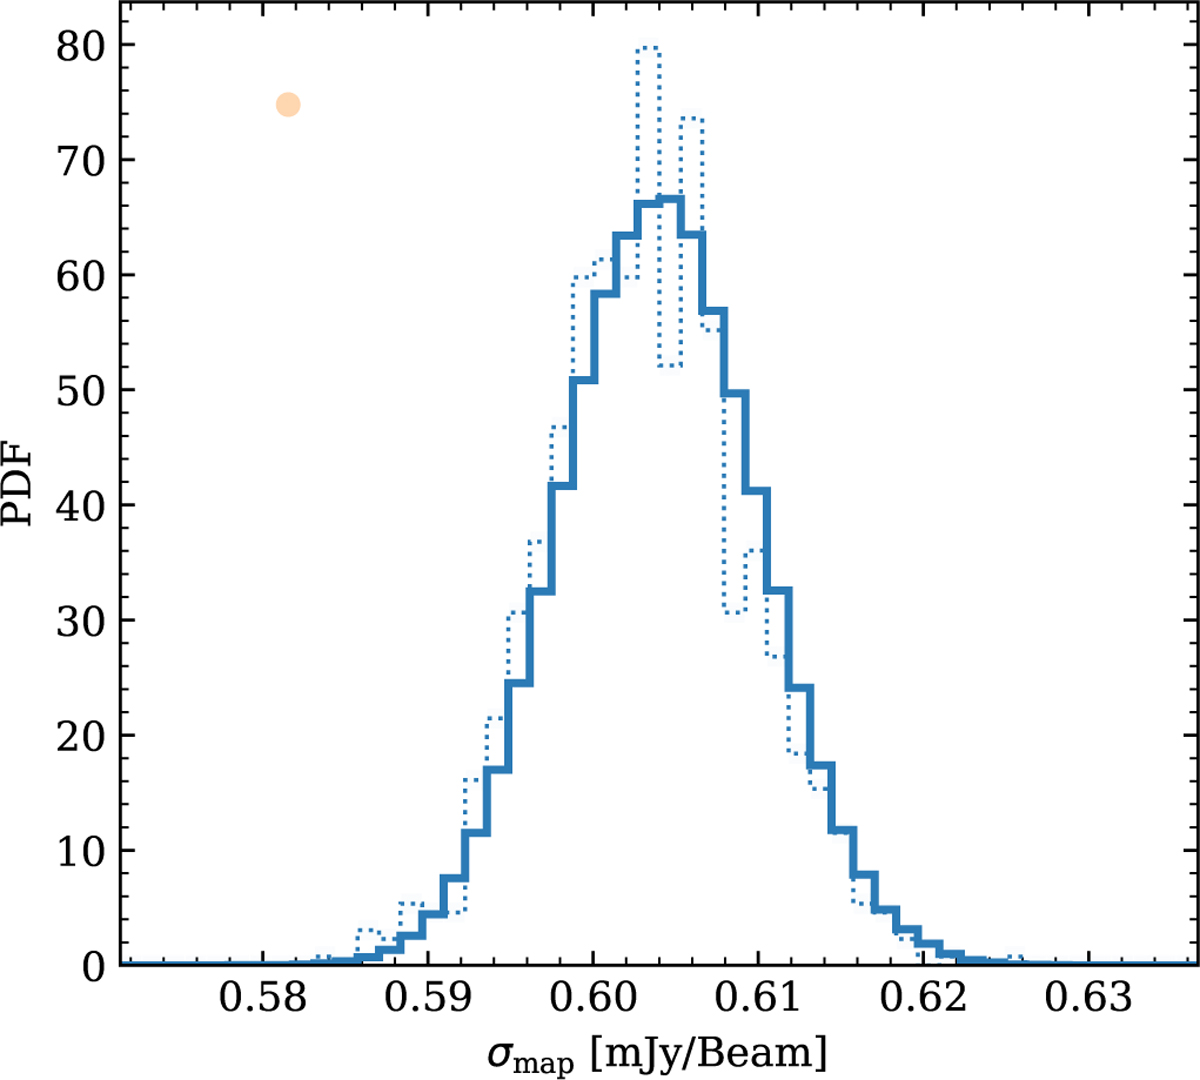
Comparison of the standard deviation σmap measured from a single simobserve simulation (i.e., using one random seed; orange point also shown in Fig 5) and the output of jackknifing that single realization (blue dotted line). The latter clearly follows the total distribution of the derived standard deviations (blue solid line of Fig. 5) instead of being centered on the single simobserve realization.
Current usage metrics show cumulative count of Article Views (full-text article views including HTML views, PDF and ePub downloads, according to the available data) and Abstracts Views on Vision4Press platform.
Data correspond to usage on the plateform after 2015. The current usage metrics is available 48-96 hours after online publication and is updated daily on week days.
Initial download of the metrics may take a while.