Fig. 1
Download original image
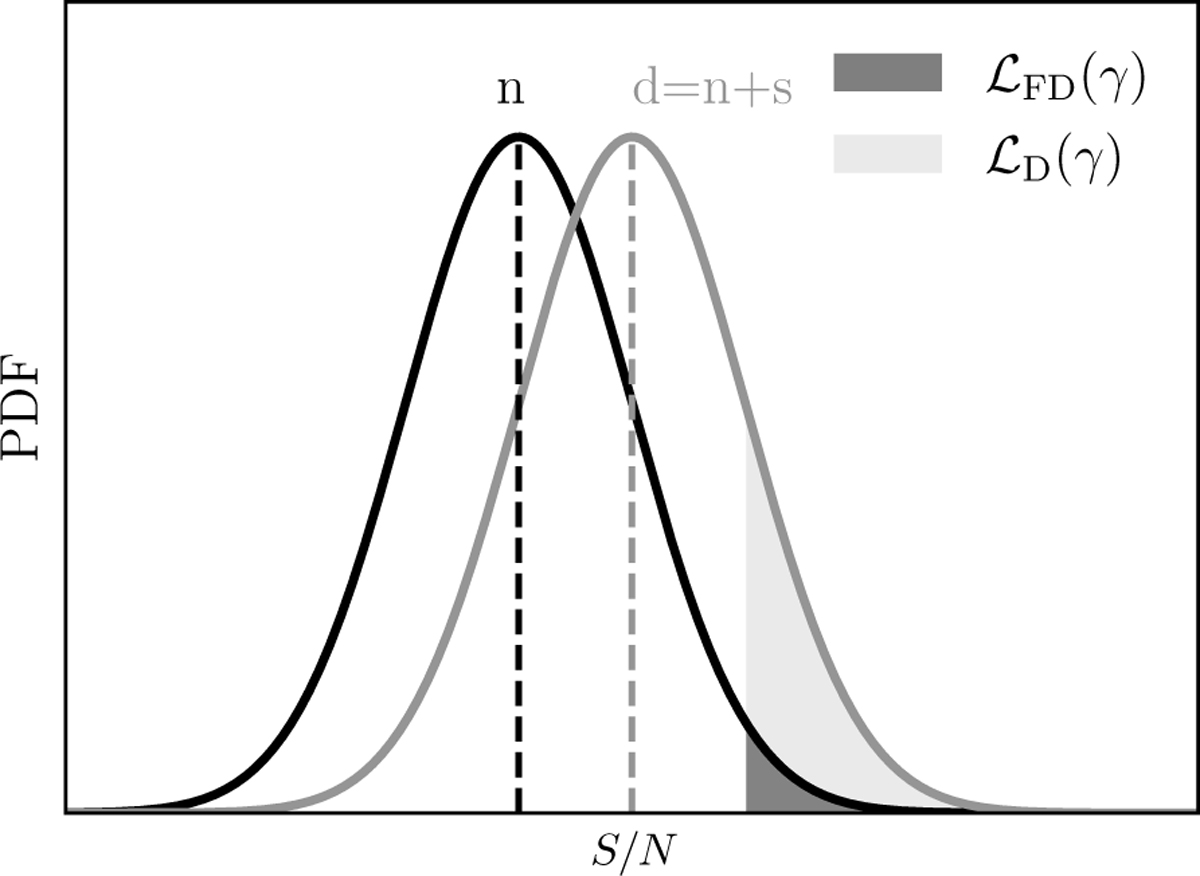
Schematic of the detection inference. Given the data, d, which is the linear combination of the noise distribution, n, plus the signal, s, we can define the likelihood of detection ![]() by setting an arbitrary S/N threshold γ and integrating the probability density function of the S/N for d from γ to ∞, as indicated with the shaded area. By nullifying s through jackknifing of d, we recover the ideal thermal noise, n, and thus compute the likelihood of a false positive detection
by setting an arbitrary S/N threshold γ and integrating the probability density function of the S/N for d from γ to ∞, as indicated with the shaded area. By nullifying s through jackknifing of d, we recover the ideal thermal noise, n, and thus compute the likelihood of a false positive detection ![]() as we do for computing
as we do for computing ![]() . The ratio of the two likelihoods provides the significance of detection. This figure is inspired by Fig. 1 of Vio & Andreani (2016).
. The ratio of the two likelihoods provides the significance of detection. This figure is inspired by Fig. 1 of Vio & Andreani (2016).
Current usage metrics show cumulative count of Article Views (full-text article views including HTML views, PDF and ePub downloads, according to the available data) and Abstracts Views on Vision4Press platform.
Data correspond to usage on the plateform after 2015. The current usage metrics is available 48-96 hours after online publication and is updated daily on week days.
Initial download of the metrics may take a while.