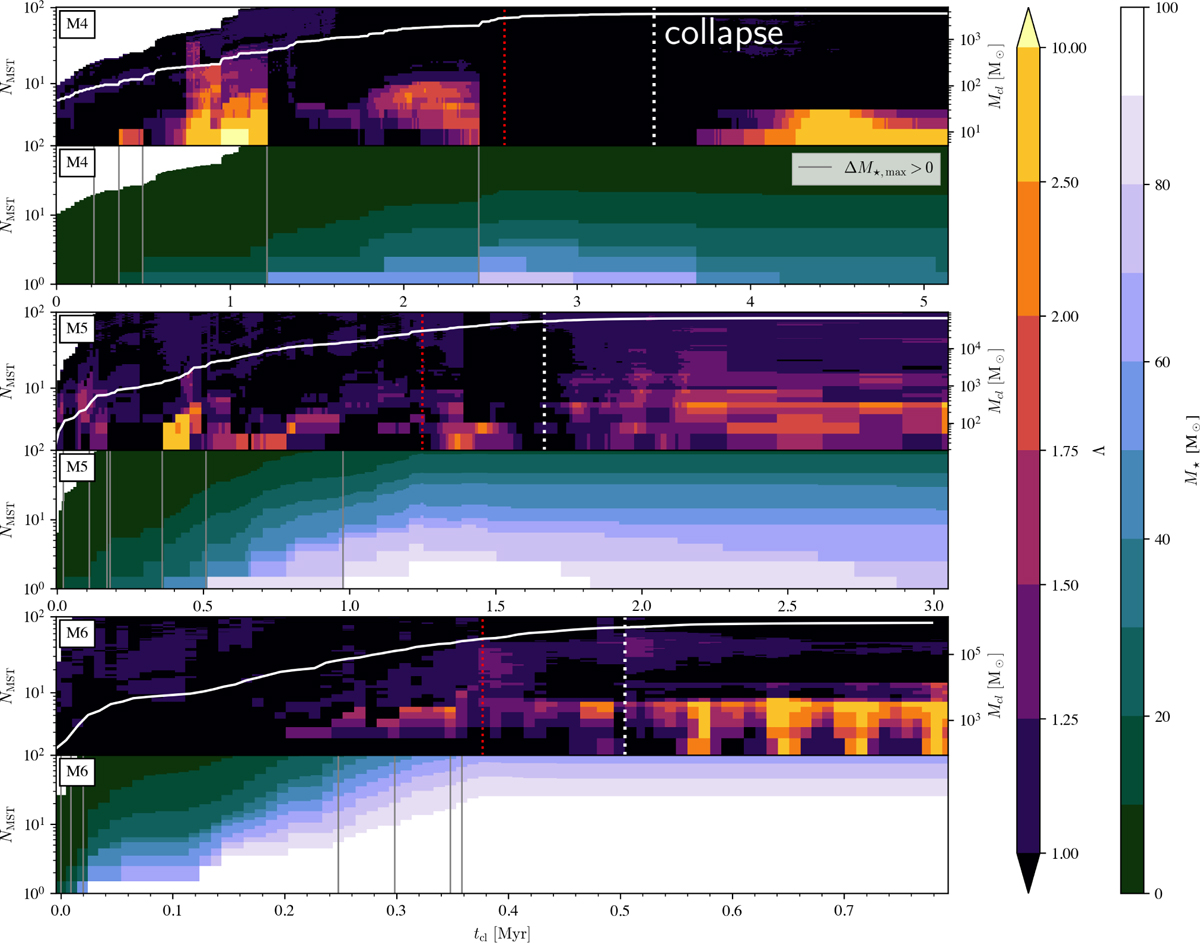
Fig. A.1
Download original image
Mass segregation ratios Λ and masses of NMST most massive stars for an older subset of the stellar populations. Same as Figure 1, but only considering stars formed before 0.75 tcollapse, indicated by the red dotted line. The three rows correspond to the M4, M5, and M6 models as labeled. In each row: (top) mass segregation ratio Λ over time for the NMST most massive stars in each cluster. The vertical dotted white lines indicate the time of collapse, where Rrms reaches a minimum. The solid white lines correspond to the right vertical axis showing the stellar mass of the cluster. (bottom) mass of the NMSTth most massive star in each cluster. The grey vertical lines indicate the formation of a new most-massive star (NMST = 1). As these are often not in the core, the time of formation, particularly in M4, corresponds to a drop in the apparent mass segregation. Note that each cluster was run to ≈ 1.5tff, leading to different absolute timescales.
Current usage metrics show cumulative count of Article Views (full-text article views including HTML views, PDF and ePub downloads, according to the available data) and Abstracts Views on Vision4Press platform.
Data correspond to usage on the plateform after 2015. The current usage metrics is available 48-96 hours after online publication and is updated daily on week days.
Initial download of the metrics may take a while.