Fig. 5
Download original image
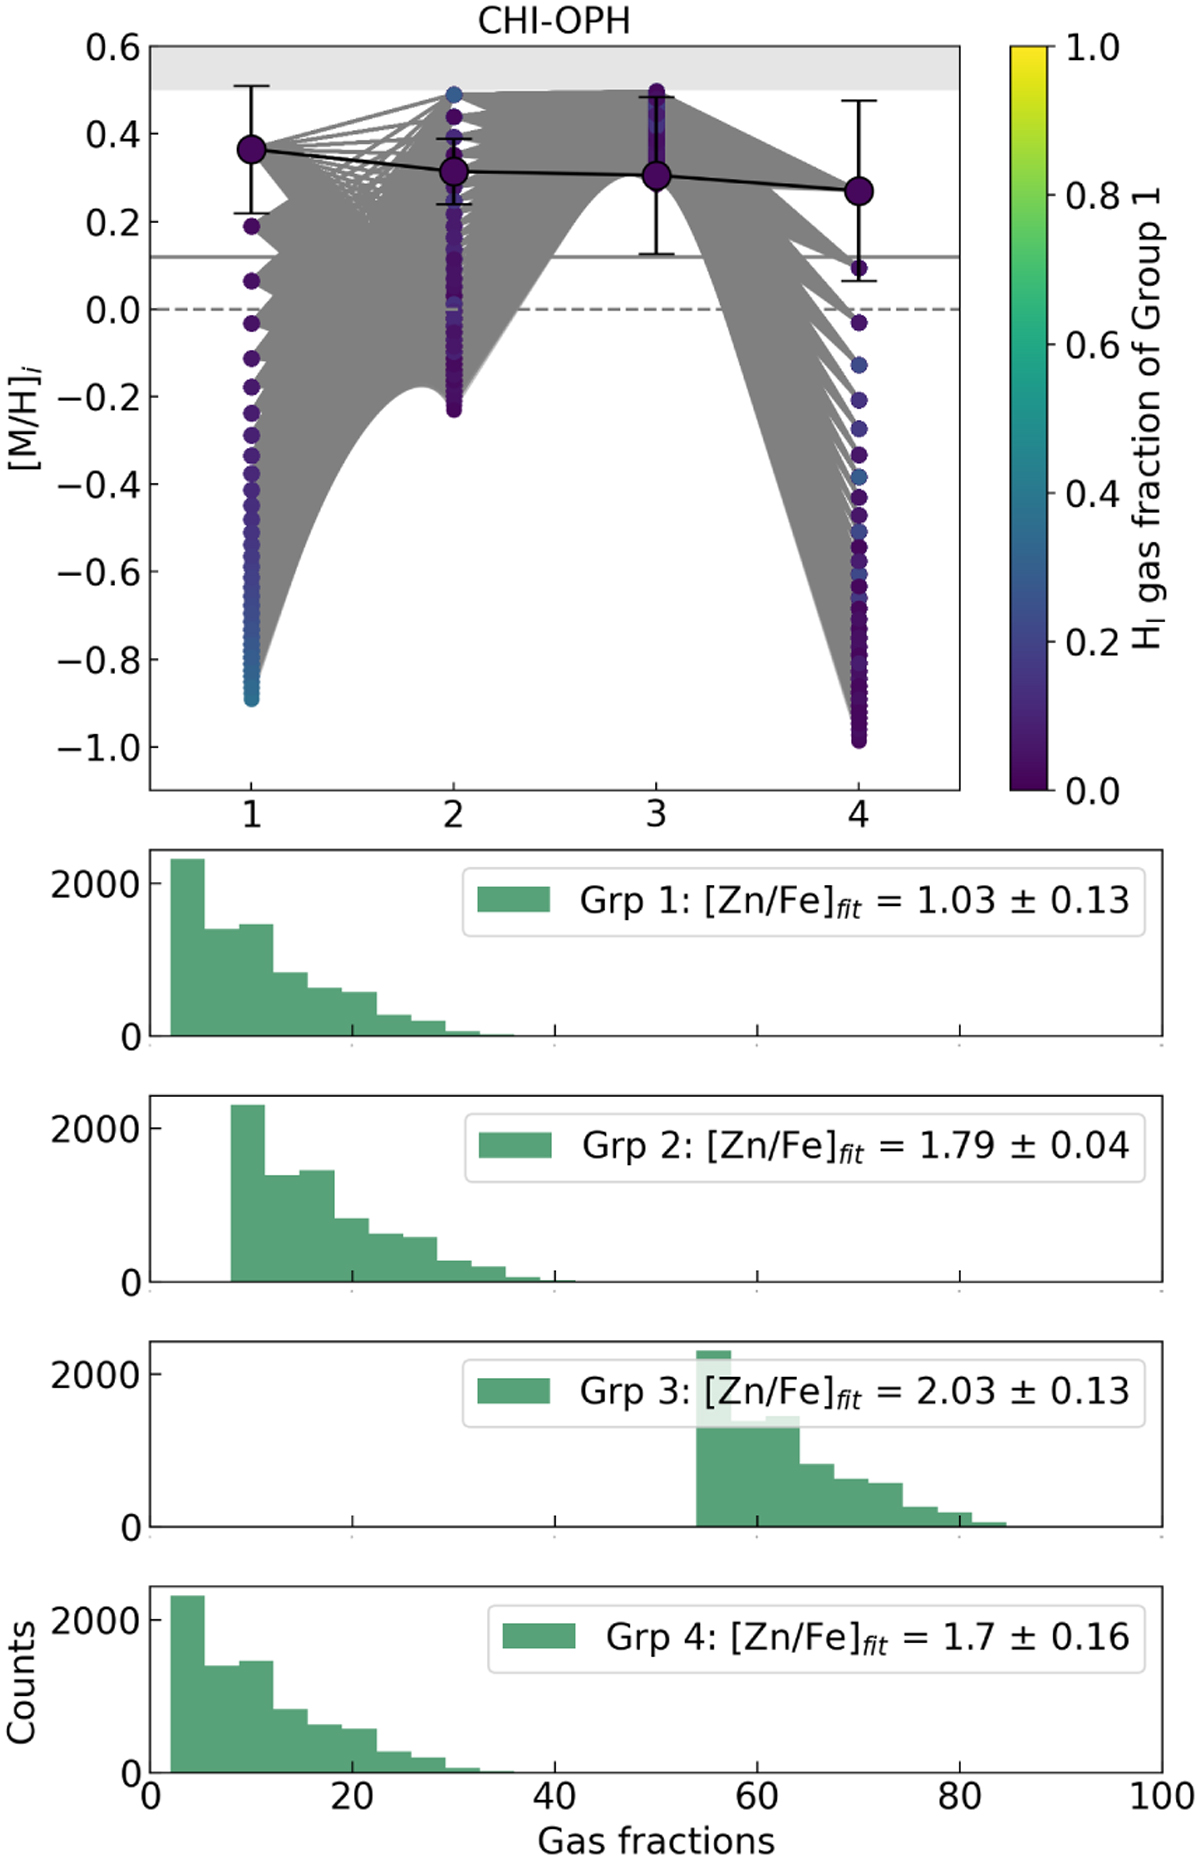
Simulation realisations for the most likely cases (where the metallicities for all groups are ≤0.5 dex) for χ Oph. The solid grey horizontal line in the top panel represents the metallicity along the whole line of sight, taking into account all of the metals. The points with black edges connected by the black line highlight the case with the minimum differences in metallicity. The grey-shaded region above 0.5 dex shows the upper bound criteria for the metallicities. The colours of the points correspond to the gas fraction of the first group N(H1) for each realisation (i.e. approximately 1% ≤ f1 ≤ 45%), as indicated in the colour bar. The histograms in the following panels are the total hydrogen gas fractions, fi, for the most likely cases. We include the level of dust depletion [Zn/Fe]fit,i in the legends.
Current usage metrics show cumulative count of Article Views (full-text article views including HTML views, PDF and ePub downloads, according to the available data) and Abstracts Views on Vision4Press platform.
Data correspond to usage on the plateform after 2015. The current usage metrics is available 48-96 hours after online publication and is updated daily on week days.
Initial download of the metrics may take a while.