Open Access
Fig. 9.
Download original image
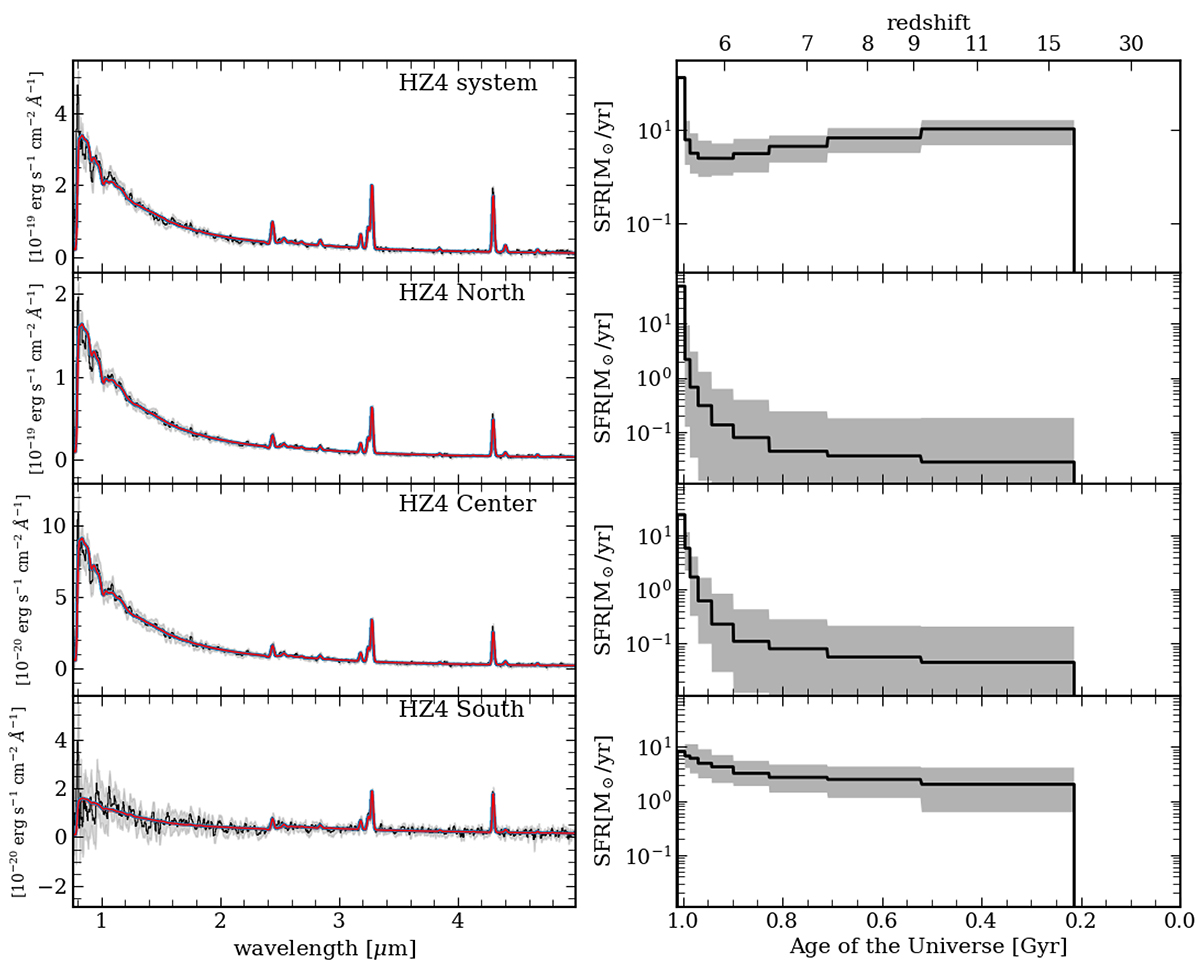
On the left: R100 spectra in black and SED best-fitting result in red extracted from the entire system, the northern clump, the central clump, and the southern clump, from top to bottom, respectively. On the right: best-fit star formation history.
Current usage metrics show cumulative count of Article Views (full-text article views including HTML views, PDF and ePub downloads, according to the available data) and Abstracts Views on Vision4Press platform.
Data correspond to usage on the plateform after 2015. The current usage metrics is available 48-96 hours after online publication and is updated daily on week days.
Initial download of the metrics may take a while.