Fig. 8.
Download original image
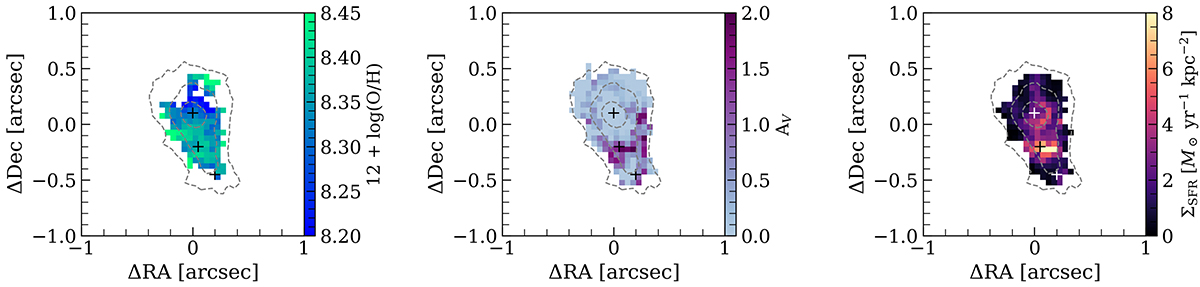
Spatially resolved properties of the narrow component. From left to right: gas-phase metallicity (12 + log(O/H)), dust extinction (AV), and dust-corrected star formation rate surface density (ΣSFR) maps. The plus signs show the location of the three components identified in Figs. 4 and 5. The gray contours represent the 5, 25, and 75σ of the narrow [O III] flux from Fig. 6.
Current usage metrics show cumulative count of Article Views (full-text article views including HTML views, PDF and ePub downloads, according to the available data) and Abstracts Views on Vision4Press platform.
Data correspond to usage on the plateform after 2015. The current usage metrics is available 48-96 hours after online publication and is updated daily on week days.
Initial download of the metrics may take a while.