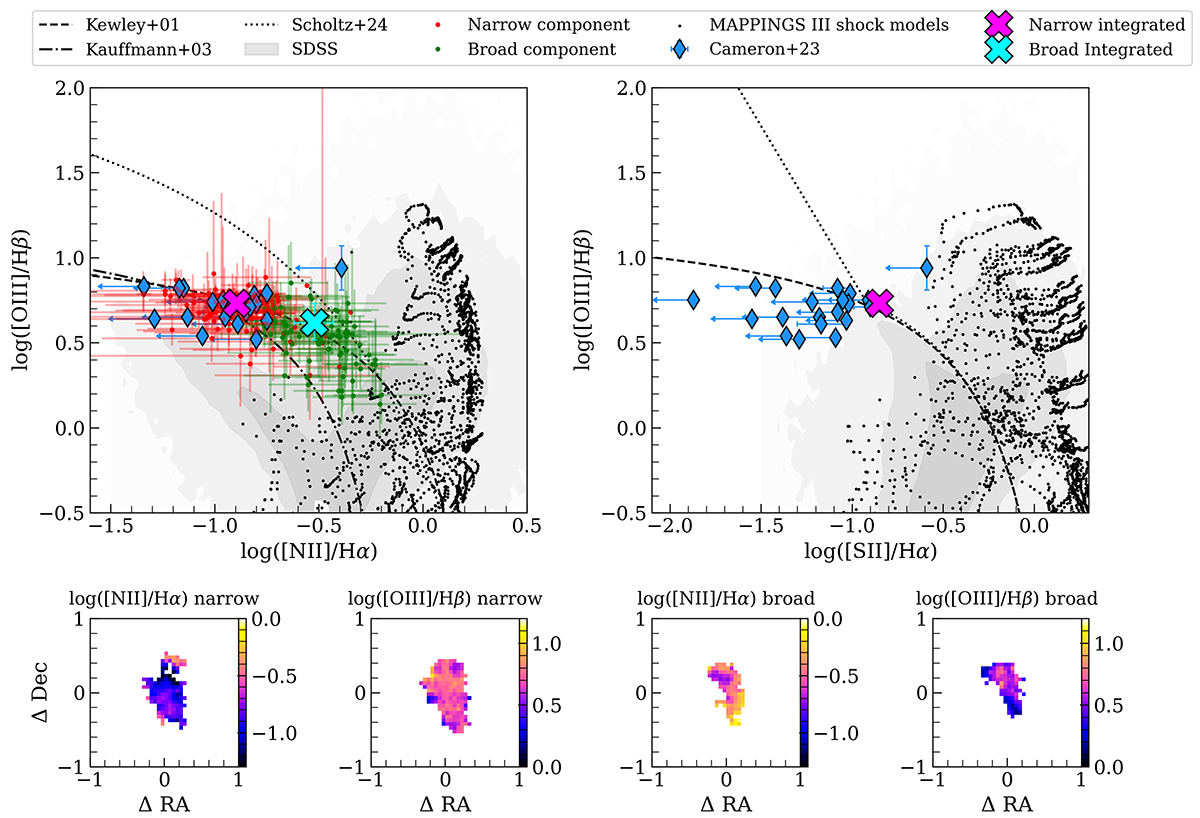
Fig. 7.
Download original image
Top panels: BPT diagram on the left and VO87 diagram on the right. As pink and turquoise crosses we show the location on the BPT diagram of the narrow and the broad component for the integrated spectrum. As red and green points we report the location in the BPT diagram of each spaxel for the narrow and broad component, respectively. The gray shaded region shows the location of SDSS galaxies, while blue diamonds show the location in this diagram of low-metallicity high-redshift (z ∼ 5.5 − 9.5) star-forming galaxies from Cameron et al. (2023). Black dots show the location of the MAPPINGS III shock model from Allen et al. (2008) with shock velocities between 200 and 1000 km/s, densities in the range 0.01 cm−3 ≤ n ≤ 1000 cm−3, solar abundances, and magnetic field between 10−4 and 10 μG. As black dashed and dash-dotted lines, we report the demarcation line for the local star-forming galaxies and AGN samples by Kewley et al. (2001) and Kauffmann et al. (2003). As the dash-dotted black line we show the demarcation line between high-z low-metallicity galaxies and AGNs by Scholtz et al. (2023). AGNs are right-ward of the line, while on the left there is a mixed population of AGNs and SF galaxies. Bottom panels: from left to right the logarithm of N2, R3 in each spaxel for the narrow component, and the logarithm of N2, R3 in each spaxel for the broad component.
Current usage metrics show cumulative count of Article Views (full-text article views including HTML views, PDF and ePub downloads, according to the available data) and Abstracts Views on Vision4Press platform.
Data correspond to usage on the plateform after 2015. The current usage metrics is available 48-96 hours after online publication and is updated daily on week days.
Initial download of the metrics may take a while.